Advertisements
Advertisements
प्रश्न
Draw a population pyramid on graph paper for India using the data given in the following table.
| Age-group-wise percentage distribution of population (estimated for 2021) |
||
| Age Group | Male | Female |
| 0–4 | 8.6 | 8.2 |
| 5–9 | 8.9 | 8.4 |
| 10–14 | 8.7 | 8.6 |
| 15–19 | 9.3 | 9.0 |
| 20–24 | 9.5 | 9.1 |
| 25–29 | 9.0 | 8.6 |
| 30–34 | 8.1 | 8.0 |
| 35–39 | 7.1 | 7.4 |
| 40–44 | 6.3 | 6.7 |
| 45–49 | 5.7 | 6.0 |
| 50–54 | 5.0 | 5.2 |
| 55–59 | 4.2 | 4.2 |
| 60–64 | 3.2 | 3.3 |
| 65–69 | 2.4 | 2.7 |
| 70–74 | 1.8 | 2.1 |
| 75–79 | 1.2 | 1.4 |
| 80+ | 0.9 | 1.2 |
आलेख
Advertisements
उत्तर
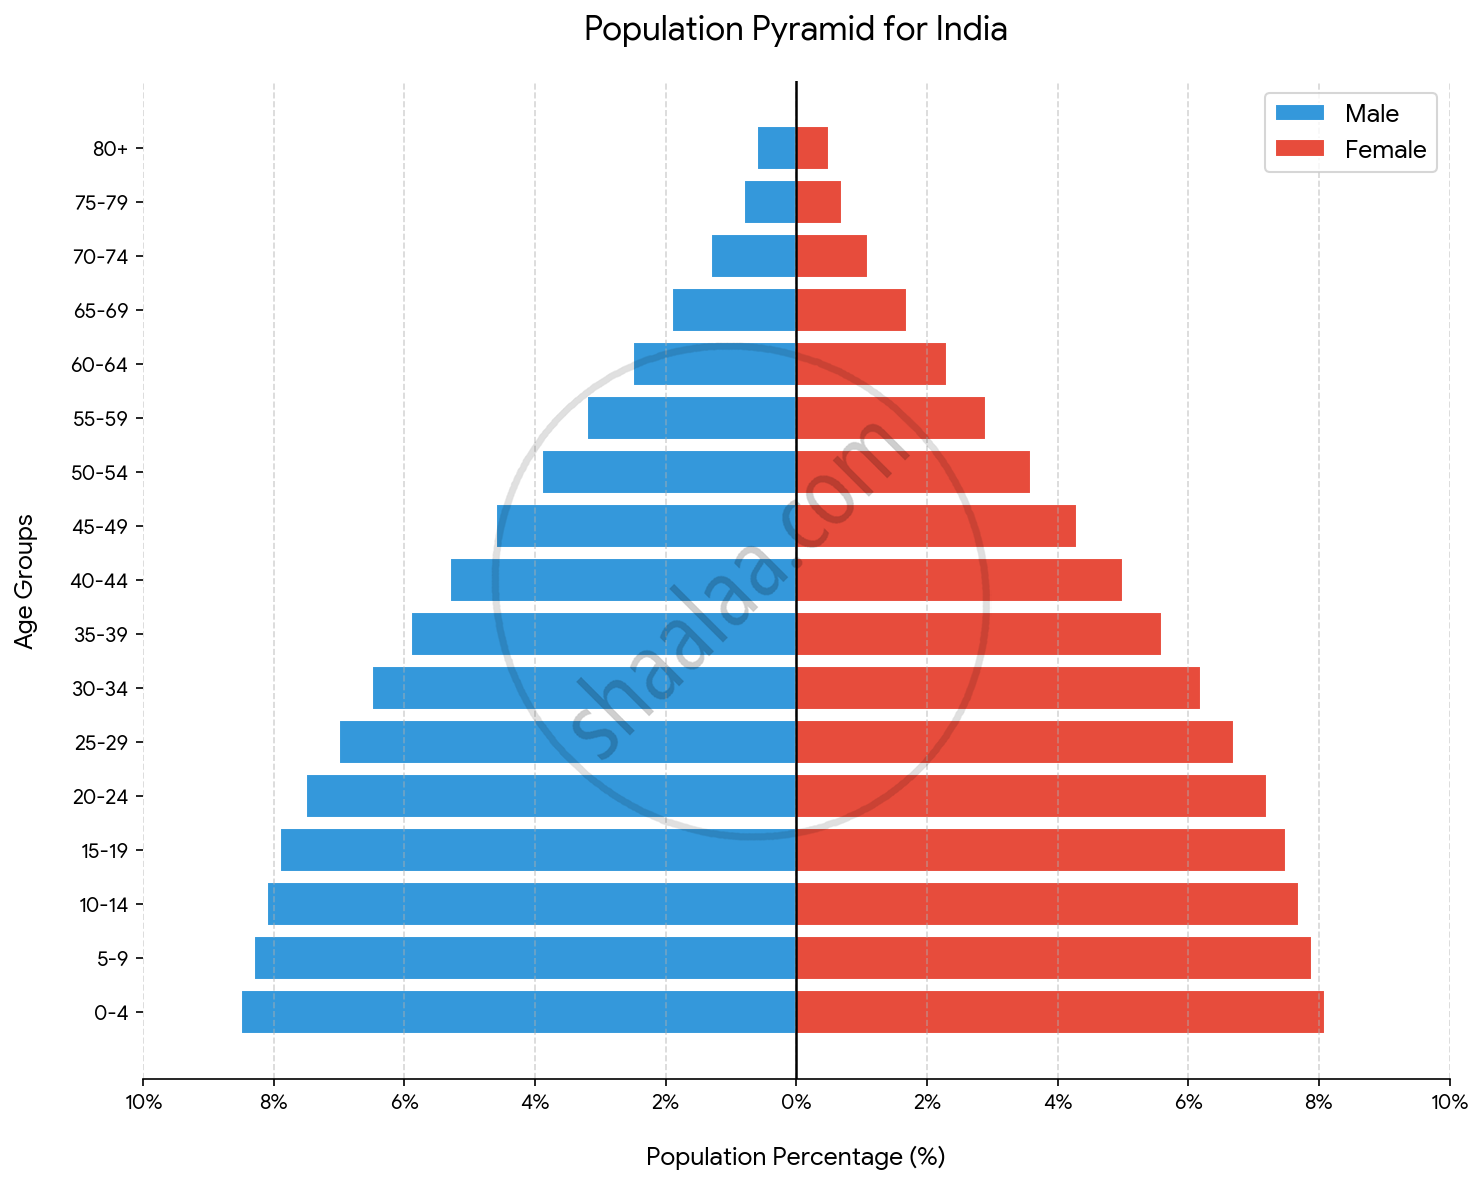
shaalaa.com
क्या इस प्रश्न या उत्तर में कोई त्रुटि है?
