Advertisements
Advertisements
प्रश्न
Construct a pie chart for the following table on sectoral contribution to GDP and discuss the difference in the contribution of the sectors in the light of effects of development during 1950-91.
| Sector | 1950-51 | 1990-91 |
Agriculture  |
59.0 | 34.9 |
Industry  |
13.0 | 24.6 |
Services  |
28.0 | 40.5 |
कृति
Advertisements
उत्तर
To construct the two pie charts, we use:
`"Central angle" = "percentage"/100 xx 360° = "percentage" xx 3.6°`
| Sector | 1950-51 | Angle |
1990-91 | Angle |
| Agriculture | 59.0 | 212.4° ≈ 212° | 34.9 | 125.64° ≈ 126° |
| Industry | 13.0 | 46.8° ≈ 47° | 24.6 | 88.56° ≈ 89° |
| Services | 28.0 | 100.8° ≈ 101° | 40.5 | 145.8° ≈ 145° |
| Total | 100 | 360° | 100 | 360° |
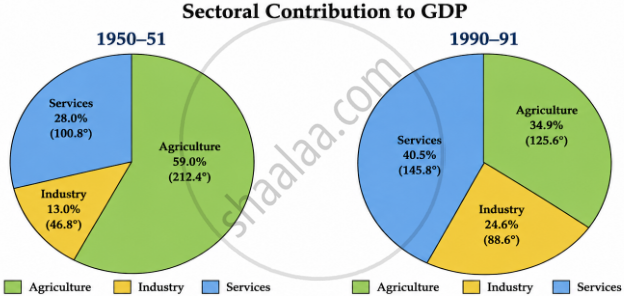
- Agriculture’s contribution to GDP fell sharply from 59.0% in 1950-51 to 34.9% in 1990-91.
- The contribution of industry increased from 13.0% to 24.6% due to industrial development and the expansion of manufacturing.
- The service sector’s contribution rose from 28.0% to 40.5%.
- Services grew because of the expansion of banking, transport, communication, education, healthcare and government services.
- These changes show that the Indian economy gradually became less dependent on agriculture.
- Industry and services became more important because of economic development, urbanisation and technological progress.
Hence, between 1950-51 and 1990-91, India shifted from a mainly agriculture-based economy to one with a larger contribution from industry and services.
shaalaa.com
क्या इस प्रश्न या उत्तर में कोई त्रुटि है?
