Advertisements
Advertisements
प्रश्न
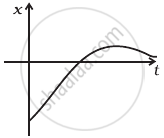
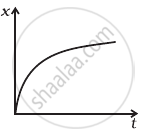
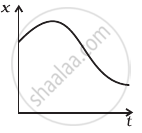
Among the four graphs (Figure), there is only one graph for which average velocity over the time intervel (0, T ) can vanish for a suitably chosen T. Which one is it?
विकल्प

Advertisements
उत्तर
Explanation:
The main concept used: Average velocity of the body will sum up to zero (average velocity is total displacement by total time). Here the above graphs show displacement for different timings in any time interval-T in the x-t graph.
We must locate the graph in which there is both positive and negative displacement at various timings, implying that these displacements are in opposing directions and that when these opposite displacements are added, net displacement or the average velocity is zero. Only in the graph is this feasible (b).

If we draw a line from point (A) on the graph at t=0 sec which is parallel to the time axis. This line can intersect the graph at B once more. Because the change in displacement (O-T) time is zero at this point, i.e., the displacements at A and B are equal, the average velocity of the body vanishes to zero.
