Advertisements
Advertisements
प्रश्न
Advertisements
उत्तर
It can be seen from the graph that the volume of the water decrease from 0°C to 4°C and the volume Is minimum at 4°C. After 4°C, the volume increases with the increase In temperature.

Variation of the volume of water with temperature
APPEARS IN
संबंधित प्रश्न
Give reasons:
Water pipes burst in severe winters.
Explain the following:
How can you relate the formation of water droplets on the outer surface of a bottle taken out of the refrigerator with the formation of dew?
On a winter day the temperature of the tap water is 20°C whereas the room temperature is 5°C. Water is stored in a tank of capacity 0.5 m3 for household use. If it were possible to use the heat liberated by the water to lift a 10 kg mass vertically, how high can it be lifted as the water comes to the room temperature? Take g = 10 m s−2.
Describe an experiment to show that water has maximum density at 4°C. What important consequences follow this peculiar property of water? Discuss the importance of this phenomenon in nature.
Explain why do vegetables and fruits get damaged during severe frost?
Observe the following diagram and write the answers to the questions given below.
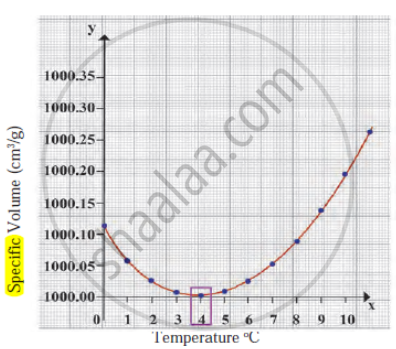
- Which process does the graph represent?
- What is the range of temperature responsible for the behaviour?
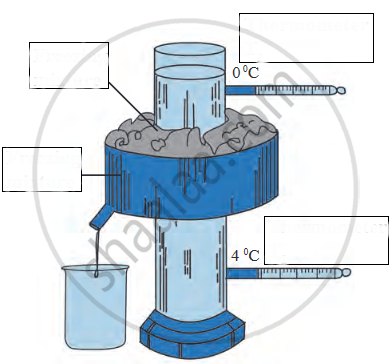
Name the following diagram appropriately.
A graph between the volume and temperature of water is shown. Explain the anomalous behaviour of water.

