Advertisements
Advertisements
प्रश्न
Use graph paper for this question.
The table given below shows the monthly wages of some factory workers.
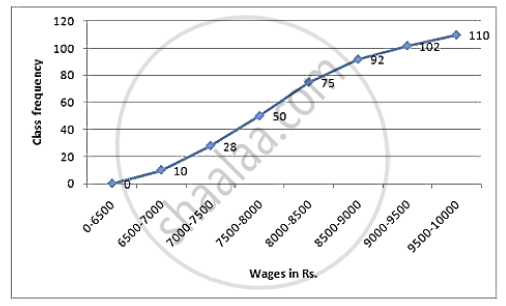
- Using the table, calculate the cumulative frequencies of workers.
- Draw a cumulative frequency curve.
Use 2 cm = ₹ 500, starting the origin at ₹ 6500 on x-axis, and 2 cm = 10 workers on the y-axis.
| Wages (in ₹.) | 6500-7000 | 7000-7500 | 7500-8000 | 8000-8500 | 8500-9000 | 9000-9500 | 9500-10000 |
| No. of workers | 10 | 18 | 22 | 25 | 17 | 10 | 8 |
आलेख
Advertisements
उत्तर
i.
| Wages | No. of workers | c.f. |
| 6500-7000 | 10 | 10 |
| 7000-7500 | 18 | 28 |
| 7500-8000 | 22 | 50 |
| 8000-8500 | 25 | 75 |
| 8500-9000 | 17 | 92 |
| 9000-9500 | 10 | 102 |
| 9500-10000 | 8 | 110 |
Total = 110
ii.
Now plot the points (7000, 10), (7500, 28), (8000, 50), (8500, 75), (9000, 92), (9500, 102) and (10000, 110) and join them to obtain an ogive.
shaalaa.com
या प्रश्नात किंवा उत्तरात काही त्रुटी आहे का?
