Advertisements
Advertisements
प्रश्न
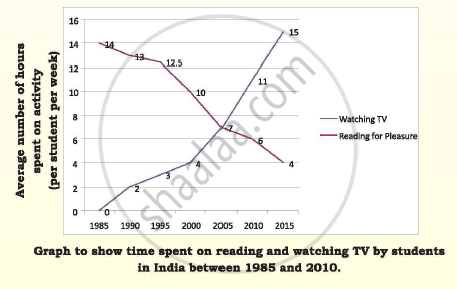
The graph below describes the average number of hours spent by students aged 11-15 years on two activities (per student per week) in India between 1985 and 2010 and gives projections for 2015. Study the information carefully and then write a paragraph interpreting the data. Include the following:
• A comparison of the trends in the two activities
• A comparison of the situation in 1985
• A comparison of the situation between 1985 and 2010
• Predictions for the future
Advertisements
उत्तर
It can be seen from the graph that on the whole, time spent by the students on viewing TV between 1985 and 2010 has been increasing ; and on reading for pleasure, it has been decreasing. For instance in the year 1985, students spent hardly any time per week on watching TV as against fourteen hours spent by them on reading for pleasure. In the year 2010, they spent only three-fourth as much time reading as they did in 1985. If the present trends continue, the students by the year 2015 would be spending their time on viewing TV, a little more. It would be almost four times higher than on reading for pleasure.
