Advertisements
Advertisements
प्रश्न
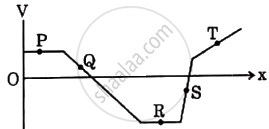
The figure represents the variation of the electric potential V at a point in a region of space as a function of its position along the x-axis. A charged particle will experience the maximum force at:
पर्याय
P
Q
R
S
Advertisements
उत्तर
S
Explanation:
The electric field is related to electric potential by:
E = `-(dV)/(dx)`
Force on a charge:
F = qE
Thus, the magnitude of force depends on the slope of the V vs x graph.
A steeper slope has a larger electric field.
Flat region having zero force.
The graph is horizontal (constant potential) at P.
`(dV)/dx` = 0
The graph has a moderate negative slope at Q. This means a finite electric field and moderate force.
Again, the graph is flat (constant potential) at R.
The graph rises very steeply (large positive slope) at S. Since the electric field magnitude depends on slope.
|E| = `|(dV)/dx|`
Thus, the force magnitude is maximum at S.
