Advertisements
Advertisements
प्रश्न
The diagram below shows the change of phases of a substance on a temperature vs time graph on heating the substance at a constant rate.
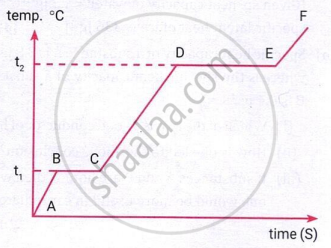
- Why is the slope of CD less than slope of AB?
- What is the boiling and melting point of the substance?
लघु उत्तर
Advertisements
उत्तर
(i) The slope of CD is less than that of AB because the specific heat capacity of the liquid is greater than that of the solid. Hence, the temperature of the liquid rises more slowly than that of the solid when heated at a constant rate.
(ii)
- Melting point = \(t_1\) (represented by BC).
- Boiling point = \(t_2\) (represented by DE).
shaalaa.com
या प्रश्नात किंवा उत्तरात काही त्रुटी आहे का?
