Advertisements
Advertisements
प्रश्न
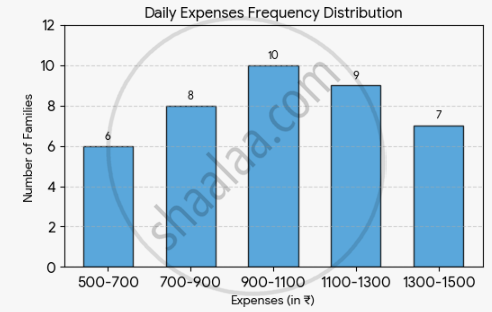
The daily expenses of 40 families has been shown by the following frequency distribution:
| Expenses (in ₹) |
500 – 700 | 700 – 900 | 900 – 1100 | 1100 – 1300 | 1300 – 1500 |
| Number of families |
6 | 8 | 10 | 9 | 7 |
Find the mean daily expenses.
बेरीज
Advertisements
उत्तर
1. Frequency distribution table
| Expenses (in ₹) |
Frequency (fi) |
Class Mark `bb(((x_i = "Lower" + "Upper")/2)` |
fi × xi |
| 500 – 700 | 6 | 600 | 3,600 |
| 700 – 900 | 8 | 800 | 6,400 |
| 900 – 1100 | 10 | 1,000 | 10,000 |
| 1100 – 1300 | 9 | 1,200 | 10,800 |
| 1300 – 1500 | 7 | 1,400 | 9,800 |
| Total | Σfi = 40 | Σfixi = 40,600 |
2. Apply the mean formula
`barx = (40,600)/40`
`barx = 1,015`
shaalaa.com
या प्रश्नात किंवा उत्तरात काही त्रुटी आहे का?
