Advertisements
Advertisements
प्रश्न
‘The agricultural sector has the largest share of Indian workers.’ – Explain.
Advertisements
उत्तर
The occupational composition of India’s population shows a large proportion of primary sector workers compared to secondary and tertiary sectors. In India, about 58.2 percent of the total working population are cultivators and agricultural laborers, whereas only 4.2% of workers are engaged in household industries and 37.6 % are other workers including non-household industries, trade, commerce, construction and repair, and other services. India is an agricultural country with a maximum population engaged in it as job opportunities in the other sectors are limited due to the low rate of infrastructural development. Workers are declining over the last few decades from 66.85% in 1991 to 58% in 2001 leading to rising in the share of the tertiary sector.
APPEARS IN
संबंधित प्रश्न
A: Assertion: In the population pyramid, a broad base indicates a high number of children in a country.
R: Reasoning: Broad apex is an indicator of the high number of elderly in a country
Give geographical reasons:
Literacy rate of a country is an indicator of its socio-economic development.
Broad base with narrowing apex shows that more people die at each higher band. It shows ______.
A person who can write, read and do mathematical calculations in the country is known as ______.
Identify the incorrect factor
Regions having literacy more than 80%:
Identify the incorrect factor
Pull factors of migration:
Give an account of the occupational structure of India’s population.
Which one of the following figures represents the working age group of the population?
Divide population based on the place of residence.
What does the literacy rate denote for India?
What does the literacy rate of a country indicate?
What was the percentage of urban population in the world in 2011?
What is life expectancy in India?
A worker is known as main worker, who works atleast ____________.
Which one of the following country lowest sex ratio in the world?
Which one of the following reflected by Age-Sex pyramid?
Which type of age-sex pyramid is of Australia?
Study the given graph carefully and answer the following question:
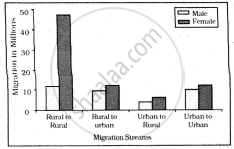
Intra-state Migration by place of Last Residence Indicating Migration Streams India, 2011
Inter-state Migration by Place of Last Residence Indicating Migration Streams India, 2011
What is the main cause of male migration from rural to urban?
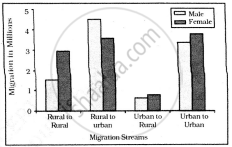
Study the given graph carefully and answer the following question:
Intra-state Migration by place of Last Residence Indicating Migration Streams India, 2011
Inter-state Migration by Place of Last Residence Indicating Migration Streams India, 2011
Which stream of migration shows the lowest trend in interstate migration?
Table: India-Class-wise number of towns and cities and their population, 2011
| Class | Population Size | Number of Cities | Total Urban Population (in thousands) | % of Total Urban Population |
| I | 1,00,000 & more | 568 | 2,27,899 | 60-45 |
| II | 50,000-99,999 | 474 | 41,328 | 10-96 |
| III | 20,000-49,999 | 1,373 | 58,174 | 15-43 |
| IV | 10,000-19,999 | 1,683 | 31,866 | 8-45 |
| V | 5,000-9,999 | 1,749 | 15,883 | 4-21 |
| VI | less than 5,000 | 424 | 1,956 | 0-52 |
Source: Census of India-2011 and India 2017, Ministry of Information and Broadcasting, Government of India.
Which class town has the maximum urban population?
Study the given graph carefully and answer the following question:
Intra-state Migration by place of Last Residence Indicating Migration Streams India, 2011
Inter-state Migration by Place of Last Residence Indicating Migration Streams India, 2011
What is the main cause of female migration from rural to urban?
Sex ratio in the world is calculated as?
Identify the country with the highest sex-ratio in the world.
Which of the following is true about age sex pyramid?
- It depicts number of males and females in different age groups.
- It is of various shapes, depending upon the population of a country.
- Age-sex pyramid of Bangladesh and Mexico are similar.
Identify the correct group or factor.
Observe the following graph and answer the question given below.

- Which region has the highest literacy rate?
- Which region has the lowest literacy rate?
- In which region does women fare better than men in literacy rate?
- Write a concluding paragraph about the graph.
- What does this graph tells us?
Which one of the following is the largest linguistic group of India?
Draw a neat, labelled diagram
Pyramids of underdeveloping countries.
Which one of the following is the largest linguistic group of India?
