Advertisements
Advertisements
प्रश्न
Show, with the help of a diagram, the effect of the following change on the equilibrium price:
When the demand for a commodity alone increases.
आकृती
दीर्घउत्तर
Advertisements
उत्तर
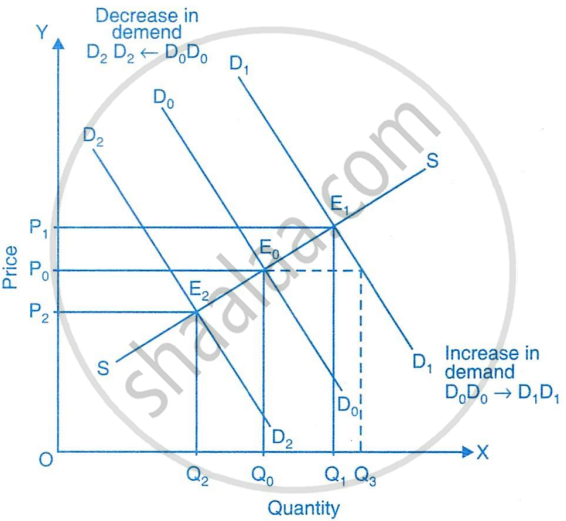
In the diagram, the original demand and supply curves are shown as D0D0 and SS, respectively. These curves intersect at point E0, which represents the initial equilibrium, with OP0 as the equilibrium price and OQ0 as the equilibrium quantity.
When there is an increase in demand, the demand curve shifts rightward from D0D0 to D1D1. At the same price OP0, the new quantity demanded rises to OQ3, but the quantity supplied stays at OQ0. This causes an excess demand equal to Q0Q3. As a result, the shortage pushes the price upward, moving the market toward a new equilibrium.
shaalaa.com
या प्रश्नात किंवा उत्तरात काही त्रुटी आहे का?
