Advertisements
Advertisements
प्रश्न
Read the following graph and answer the questions:
- Which country’s national income was highest in 2016 and was it how much?
- Comparing India and Brazil, which country had a higher national income in 1980?
- Comparing India and Brazil, which country had a higher income in 2016?
- Tell the difference between the GNP of Brazil and India in 2016.
- Calculate the difference between the national incomes of developed and developing countries in 2016.

Advertisements
उत्तर
a. National income is the money value of all the final goods and services produced within the domestic territory of the country during a particular period of time, generally within a year. In 2016, the national income of the US was the highest. It was nearly 1900 million US dollars.
b. National income is the money value of all the final goods and services produced within the domestic territory of the country during a particular period of time, generally within a year. In 1980, Brazil had a higher national income compared to India. The difference between their incomes is only negligible.
c. National income is the money value of all the final goods and services produced within the domestic territory of the country during a particular period of time, generally within a year. In 2016, India had a higher national income compared to Brazil. The national income of India has just crossed 200 million US dollars, while the national income of Brazil is reaching 200 million US dollars.
d. National income is the money value of all the final goods and services produced within the domestic territory of the country during a particular period of time, generally within a year. In 2016, India had a higher national income compared to Brazil. The national income of India has just crossed 200 million US dollars, while the national income of Brazil is reaching 200 million US dollars.
e. National income is the money value of all the final goods and services produced within the domestic territory of the country during a particular period of time, generally within a year. The US is a developed economy while both Brazil and India are developing countries. There is a huge gap between the national incomes of both developed and developing countries. In 2016, the US had a national income of nearly 1900 million US dollars, but the national income of India has just crossed 200 million US dollars. There exists a huge gap between the two amounting to about 1700 million US dollars.
APPEARS IN
संबंधित प्रश्न
Select the correct option and rewrite the sentence:
------------ is seen as one of the world’s major markets and contributor to economic growth of the world.
Draw a suitable Line graph with the help of the following statistical information and answer the following questions.
| Number of international tourists (in lakhs) | |||||
| International tourists (in lakhs) |
1995 | 2000 | 2005 | 2010 | 2015 |
| Brazil | 20 | 50 | 45 | 40 | 50 |
| India | 20 | 21 | 30 | 50 | 140 |
- In which year is the number of tourists maximum in India?
- In the year 2000, how many tourists visited Brazil?
- In which year do India and Brazil have the same number of international tourists?
B) Read the following graph and answer the questions :
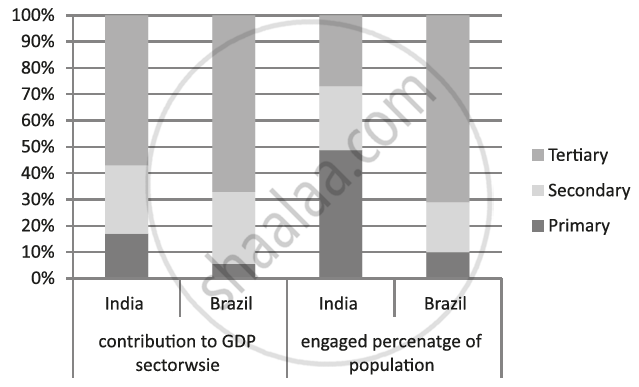
i) In which country is the contribution of tertiary sector higher ?
ii) In India, most people are engaged in which occupational sector?
iii) Which country has only 10% of the population engaged in primary sector?
iv) How much does tertiary sector contribute to the national income of India?
v) Which sector contributes the least in the Brazilian national income?
vi) What is the percentage of people engaged in the secondary sector in Brazil?
Mark the following in the outline map of Brazil supplied to you, write the names and give index

- Marajó Island
- Pico-De-Neblina
- Pantanal Wetland
- Drought Quadrilateral
- Caatinga
- Golden Lion-Tamarin
India’s per capita income is less than Brazil due to ______.
The economy of Brazil is mainly dependent on the ______ activities there.
Give reason.
There is mixed economy in Brazil and India.
Which type of occupations gives a boost to the development of a country’s economy?
India and Brazil are progressing in the fields of ______ education and industry.
Read the following graph and answer the questions:
India and Brazil
Contribution of sectors in national income and percentage of population engaged in the sector.

Questions:
- Name the sectors mentioned in the graph.
- Which sector contributes the highest in National income in India?
- How much percent of population is engaged in primary sector in Brazil?
- Out of given two countries, the share of primary sector to the national income is less.
- Which country's contribution of tertiary sector to the national income is less?
- In which sector 19% population of Brazil is engaged?
