Advertisements
Advertisements
प्रश्न
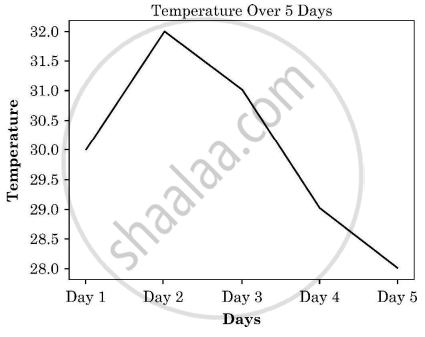
Gurkirat has to fill in the blanks in the given Python program that generates a line plot as shown below. The given line plot represents the temperature (in degree Celcius) over five days as given in the table:
| Days | Temperature |
| Day 1 | 30 |
| Day 2 | 32 |
| Day 3 | 31 |
| Day 4 | 29 |
| Day 5 | 28 |
import _______ as plt # Statement-1
days = ['Day 1', 'Day 2', 'Day 3', 'Day 4', 'Day 5']
temp = [30, 32, 31, 29, 28]
plt._____ (days, temp) # Statement-2
plt.xlabel ('_______') # Statement-3
plt.ylabel ('Temperature')
plt.title('________ ') # Statement-4
plt.show()
Write the missing statements according to the given specifications:
- Write the suitable code to import the required module in the blank space in the line marked as Statement-1.
- Fill in the blank in Statement-2 with a suitable Python function name to create a line plot.
- Refer to the graph shown and fill in the blank in Statement-3 to display the appropriate label for x-axis.
- Refer to the graph shown and fill in the blank in Statement-4 to display the suitable chart title.
रिकाम्या जागा भरा
Advertisements
उत्तर
import matplotlib.pyplot as plt
days = ['Day 1', 'Day 2', 'Day 3', 'Day 4', 'Day 5']
temp = [30, 32, 31, 29, 28]
plt.plot (days, temp)
plt.xlabel ('Days')
plt.ylabel ('Temperature')
plt.title('Temperature Over 5 Days')
plt.show()
shaalaa.com
या प्रश्नात किंवा उत्तरात काही त्रुटी आहे का?
