Advertisements
Advertisements
प्रश्न
Figures (A), (B) and (C) given below represent different types of Demand curves.
 |
 |
 |
| (A) | (B) | (C) |
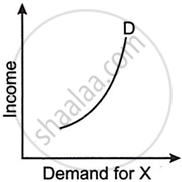
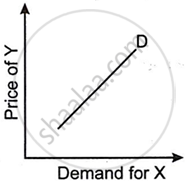
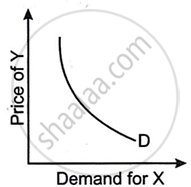
What kind of goods do each of these Demand curves represent? Give a reason for each of the curves.
Advertisements
उत्तर
Figure (A) shows a demand curve that slopes upward with income on the Y-axis and Demand for X on the X-axis, representing normal items whose demand increases as the consumer's income rises.
Figure (B) shows a straight upward sloping demand curve with Demand for X on the X-axis and Price of Y on the Y-axis, representing substitute goods. As the price of the substitute goods increases, so does the demand for the other goods.
Figure (C) shows demand for X on the X-axis and price for Y on the Y-axis, with the demand curve representing demand for complementary items, where an increase in the price of complementary goods causes a decrease in demand for other goods and vice versa.
APPEARS IN
संबंधित प्रश्न
Explain the law of demand with its assumptions.
State and explain the ‘law of demand’ with its exceptions.
Explain the effect of change in prices of the related goods on demand for the given good.
Market of a commodity is in equilibrium. Demand for the commodity "increases." Explain the chain of effects of this change till the market again reaches equilibrium. Use diagram.
Prices of other goods and demand for the given good.
What does a rightward shift of demand curve indicate?
Fill in the blank using proper alternative given in the bracket:
Market demand is a total demand of...............buyers.
Define or explain the following concept.
Market Demand .
Do you agree with the following statement? Give reason
There are no exceptions to the law of demand.
Do you agree with the following statement? Give reason
State and explain the law of demand.
The shape of supply curve is ______
The demand curve for foreign exchange is ______
Assertion (A): The demand curve is downward sloping.
Reason (R): The income effect means with a fall in the price of a good, the consumer's real income or purchasing power rises and he demands more units of the good.
In case of perfect competition, AR curve is:
Explain why the demand curve slopes downwards.
Study the following diagram and answer the questions:

Questions:
- In which direction does the demand curve slope?
- What is the reason for the fall in demand of rice from Q0 to Q1?
What does the downward slope of the demand curve indicate?
