Advertisements
Advertisements
प्रश्न
Explain the effect of change in prices of the related goods on demand for the given good.
Advertisements
उत्तर
Effect of change in price of related goods:
i. Demand for a commodity in relation to price of the substitute good When the price of one good falls, it becomes cheaper in relation to another good. As a result, one good is substituted for the other good such as coffee and tea. Assume tea and coffee are two substitute goods. D1 is the demand curve for the demand of tea in diagram (a).
Increase in price of substitute good:
When the price of tea is OP1, the quantity demanded is OT1 as shown in diagram (a). If there is an increase in the price of the substitute good coffee, then the demand curve for tea shifts to the right. Now, the consumer is willing to buy P1C2 quantity of tea which is equal to OT2. Greater the purchase of a commodity at its constant price points to a situation of increase or forward shift in the demand curve. The consumer demand curve shifts from D1 to D2, consuming more of tea even when its price is constant.
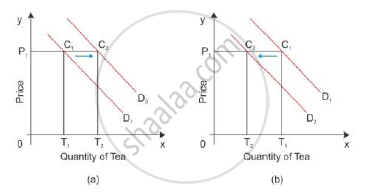
Decrease in price of substitute good:
When there is a decrease in the price of the substitute good coffee, the demand curve for tea shifts to the left even when its price is constant. When the price of tea is OP1, the quantity demanded is OT1 as shown in the diagram (b). Now, the consumer is willing to buy P1C2 quantity of tea which is equal to OT2. Thus, the consumer shifts from D1 to D2, consuming less of tea even when the price of tea is constant. This is a situation of backward shift in the demand curve.
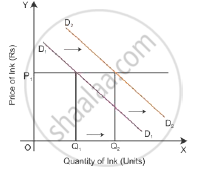
ii. Demand for a commodity in relation to price of the complementary good Complementary goods are purchased jointly such as ink and ink pens. Increase in price of complementary good: If there is an increase in the price of a good, then the demand for another good will decline. So the demand curve shifts parallel to the left, i.e. from D1D1 to D2D2.

Decrease in price of complementary good:
If there is a decrease in the price of a good, then the demand for another good will increase. So the demand curve shifts parallel to the right, i.e. from D1D1 to D2D2.
APPEARS IN
संबंधित प्रश्न
Explain the law of demand with its assumptions.
State and explain the ‘law of demand’ with its exceptions.
When does ‘increase’ in demand take place?
Prices of other goods and demand for the given good.
Explain how do the following influence demand for a good:
i. Rise in income of the consumer.
ii. Fall in prices of the related goods
Distinguish between individuals demand and market demand.
Good Y is a substitute of good X. The price of Y falls. Explain the chain of effects of this change in the market of X.
If with the rise in the price of good Y, demand for good X rises, the two goods are: (Choose the correct alternative)
a. Substitutes
b. Complements
c. Not related
d. Jointly demanded
Fill in the blank using proper alternative given in the bracket:
Market demand is a total demand of...............buyers.
Define or explain the following concept.
Market Demand .
State with reason, whether you Agree or Disagree with the following statement.
The demand curve slopes downward from left to right.
Assertion (A): Under exceptional cases, demand curve has a positive slope.
Reasoning (R): In exceptional cases, consumer buys more when the price of a commodity rises and buys less when the price of commodity falls.
The shape of supply curve is ______
The demand curve for foreign exchange is ______
Explain why the demand curve slopes downwards.
Study the following diagram and answer the questions:

Questions:
- In which direction does the demand curve slope?
- What is the reason for the fall in demand of rice from Q0 to Q1?
How is the market demand curve constructed from individual demand curves?
In a demand schedule, what do the X-axis and Y-axis represent when plotting the demand curve?
