Advertisements
Advertisements
प्रश्न
Draw a straight-line demand curve joining both the axes. Indicate the following on the demand curve.
Elasticity of demand is equal to zero
Advertisements
उत्तर
A straight-line demand curve joining both the axes is shown below:

The elasticity of demand is different at different points.
`"measured by Elasticity" = "Lower segment of demand curve"/ "Upper segment of demand curve"`
The elasticity of demand is equal to zero at point A on the diagram, as the lower segment is zero.
APPEARS IN
संबंधित प्रश्न
When does ‘increase’ in demand take place?
Prices of other goods and demand for the given good.
Good Y is a substitute of good X. The price of Y falls. Explain the chain of effects of this change in the market of X.
If with the rise in the price of good Y, demand for good X rises, the two goods are: (Choose the correct alternative)
a. Substitutes
b. Complements
c. Not related
d. Jointly demanded
How does change in the price of a substitute good affect the demand of the given good? Explain with the help of an example.
What does a rightward shift of demand curve indicate?
Define or explain the following concept.
Market Demand .
State with reason, whether you Agree or Disagree with the following statement.
The demand curve slopes downward from left to right.
Do you agree with the following statement? Give reason
There are no exceptions to the law of demand.
State with reasons whether you ‘agree’ or ‘disagree’ with the following statement.
Demand curve slopes downward from left to right.
Statements related to decrease in demand
- It is a type of change in demand
- It takes place due to unfavourable changes in other factors like tastes, income etc.
- Price remains constant
- Demand curve shifts to the right hand side of the original demand curve
The demand curve for foreign exchange is ______
Study the following table and answer the questions:
| Price of Ice Cream (₹) | Quantity Supplied | Market Supply | ||
| Seller A | Seller B | Seller C | (A + B + C) | |
| 50 | 0 | 2 | 5 | 7 |
| 100 | 1 | `square` | 10 | 15 |
| 150 | `square` | 6 | 15 | 23 |
| 200 | 3 | 8 | 20 | `square` |
| 250 | 4 | 10 | `square` | 39 |
Questions:
- Complete the above table.
- State whether the following statements are True or False.
(a) Market supply has a direct relation to price.
(b) As the price rises from ₹50 to ₹250, market supply rises from 7 to 39. This indicates an increase in supply.
Study the following diagram and answer the questions:

Questions:
- In which direction does the demand curve slope?
- What is the reason for the fall in demand of rice from Q0 to Q1?
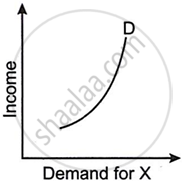
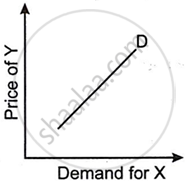
Figures (A), (B) and (C) given below represent different types of Demand curves.
 |
 |
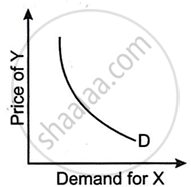 |
| (A) | (B) | (C) |
What kind of goods do each of these Demand curves represent? Give a reason for each of the curves.
What does the downward slope of the demand curve indicate?
How is the market demand curve constructed from individual demand curves?
In a demand schedule, what do the X-axis and Y-axis represent when plotting the demand curve?
