Advertisements
Advertisements
प्रश्न
Choose the correct alternative from given options:
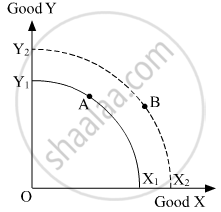
Shift from Point A on Production Possibility Curve X1Y1 to point B on X2Y2 in the given figure indicates:
पर्याय
Decrease in resources
Increase in resources
Full and efficient utilisation of resources
Wastage of resources
Advertisements
उत्तर
Shift from Point A on Production Possibility Curve X1Y1 to point B on X2Y2 in the given figure indicates: Increase in Resources
Hence, the correct answer is Increase in Resources.
APPEARS IN
संबंधित प्रश्न
Assuming that no resource is equally efficient in production of all goods, name the curve which shows production potential of the economy. Explain, giving reasons, its properties.
Production in an economy is below its potential due to unemployment. Government starts employment generation schemes. Explain its effect using production possibilities curve.
Give the meaning and characteristics of production possibility frontier.
Giving reason, comment on the shape of Production Possibilities Curve based on the following table :
| Good X (units) | Good Y (units) |
| 0 | 20 |
| 1 | 18 |
| 2 | 14 |
| 3 | 8 |
| 4 | 0 |
Giving reason, comment on the shape of Production Possibilities Curve based on the following table :
| Good X (units) | Good Y (units) |
| 0 | 4 |
| 1 | 3 |
| 2 | 2 |
| 3 | 1 |
| 4 | 0 |
Answer the following question.
Explain the meaning of opportunity cost with the help of a production possibility schedule.
Define Production Possibilities Curve. Explain why it is downward sloping from left to right.
Define flow variable.
Define flow variable.
What is a production possibility frontier?
Fill up the blank.
A Production Possibility Curve (PPC) would be convex to the origin if the Marginal Rate of Transformation (MRT) is ___________.
______ are economic units that carry out the production.
Production possibility curve slopes downwards from ______ to ______.
Which of the following is the result of increase in price of factors of production?
Which of the following statement is true:
______ shows the functional relationship between output and cost of production.
Which of the following statement is false?
The total output generated by the first four units of variable input is 200 units, 350 units, 450 units and 500 units. The marginal product of the third unit of input is:
