Advertisements
Online Mock Tests
Chapters
![Balbharati solutions for जियोग्राफी [अंग्रेजी] कक्षा १० महाराष्ट्र राज्य बोर्ड chapter 6 - Population - Shaalaa.com](/images/geography-english-standard-10-maharashtra-state-board_6:64aff6684df04e9e943283f0e8e55f89.jpg "Balbharati solutions for जियोग्राफी [अंग्रेजी] कक्षा १० महाराष्ट्र राज्य बोर्ड chapter 6 - Population")
Advertisements
Solutions for Chapter 6: Population
Below listed, you can find solutions for Chapter 6 of Maharashtra State Board Balbharati for जियोग्राफी [अंग्रेजी] कक्षा १० महाराष्ट्र राज्य बोर्ड.
Balbharati solutions for जियोग्राफी [अंग्रेजी] कक्षा १० महाराष्ट्र राज्य बोर्ड 6 Population Intext Questions [Pages 38 - 44]
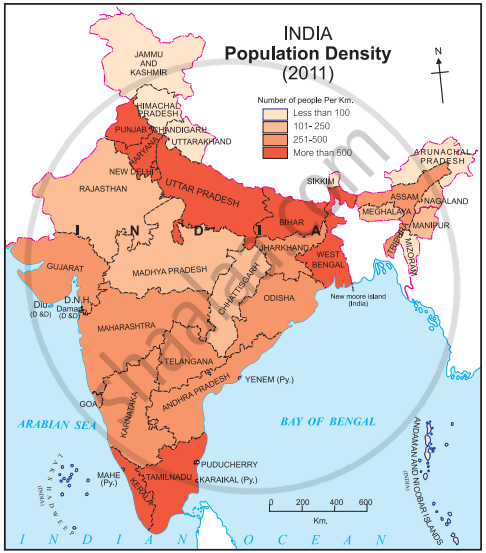
Study the maps and answer the questions.
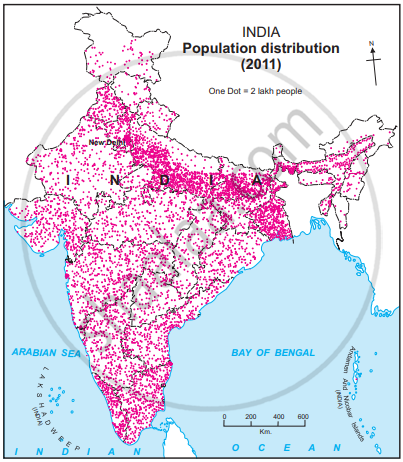
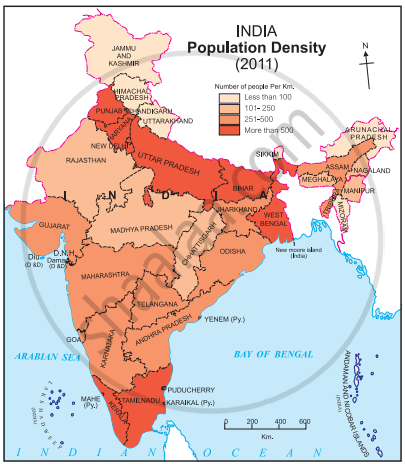
1. States with the highest population density.
2. States with the lowest population density.
3. On the basis of the maps given above, classify the distribution population in India in the following table.
| Sr. No. | Population Density (per sq. km.) |
Name of the States/Union Territories |
| 1 | less than 100 | |
| 2 | 101 to 250 | |
| 3 | 251 to 500 | |
| 4 | more than 501 |
4. Correlate the climate and physiography of India with its population distribution and write a note on it.
Observe figures and answer the questions.
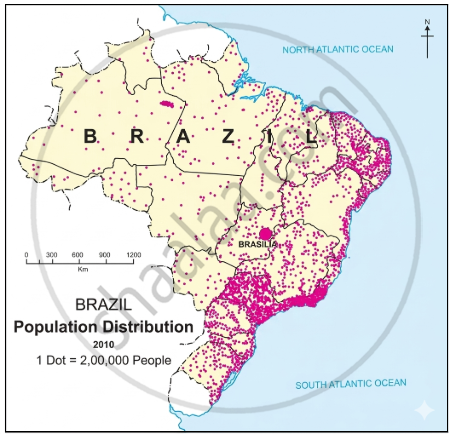
- In which area is population greatly concentrated?
- In which area is the distribution of population sparse?
- Prepare a note on factors responsible for the uneven distribution of population based on study of Brazil you have made so far.
- Identify the type of map showing distribution.
Use your brain power!
Calculate the population density of the area shown in 1 sq.km, of square in ‘a’ and ‘b’ each.
 = 80 people = 80 people |
|
|
(a) |
(b) |


Give it a try.
What could be the reasons for the lower sex ratio in any region?
In India, number of men outnumber women. Is this condition found in all the States of India? Find out!
Try this.
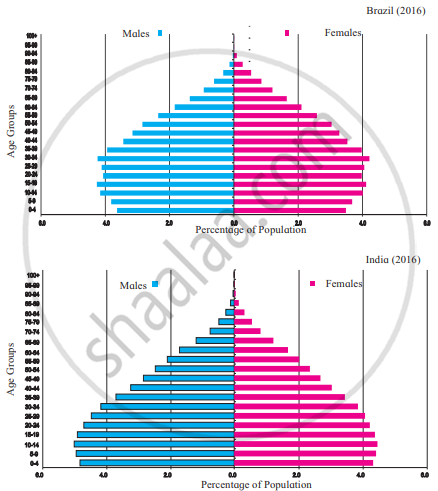
- Using the graphs given, find the difference between the males and females of various age groups.
- In which age group is this difference the maximum?
Use your brain power!
Is there a relationship between increase in life expectancy and growth of population? If yes, how?
Colours of Both
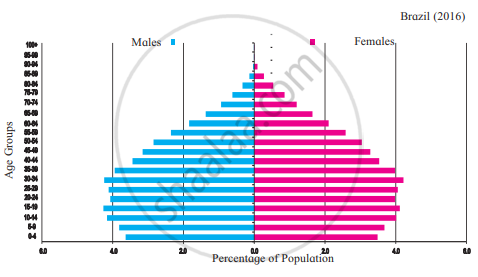
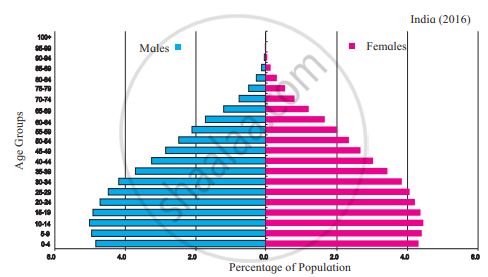
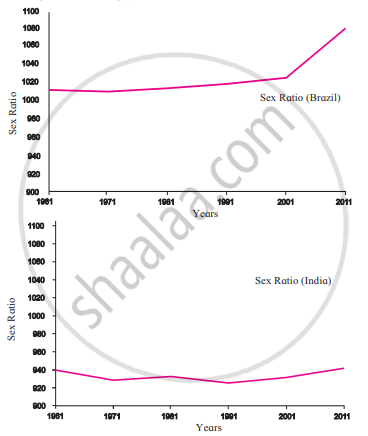
From given fig. various aspects of population composition are given. Study the graphs, discuss and answer the following questions.
Sex Ratio:
Age and Sex Pyramid:
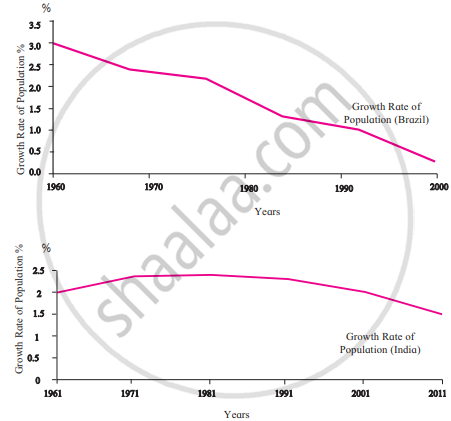
Population growth rate:
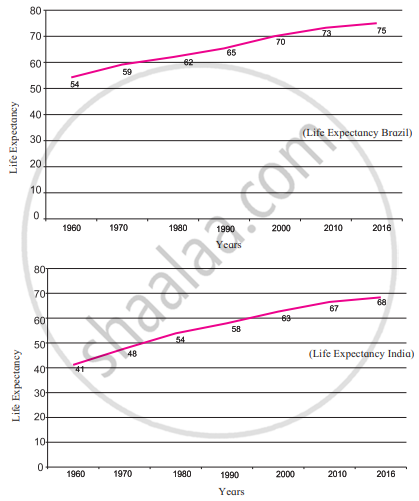
Life expectancy:
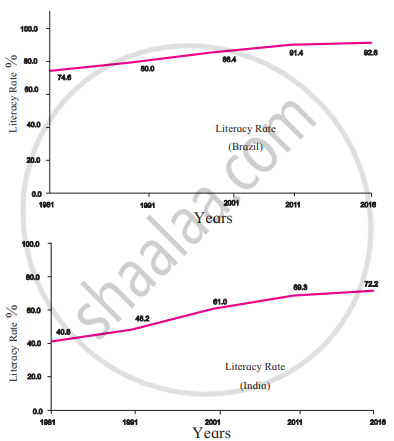
Literacy Rate:
- Which country has a higher sex ratio?
- Which country has a higher literacy rate?
- Which country is growing at a faster rate?
- Which country’s population has a higher life expectancy?
- Which country has a higher proportion of the old age people?
Think about it.
What should be done so that our manpower is utilized properly, sex ratio improves and population growth is controlled? Write two to three sentences on each.
Use your brain power!
If the proportion of dependent age groups increases in the composition of population, how will it affect the economy of a country?
Give it a try.
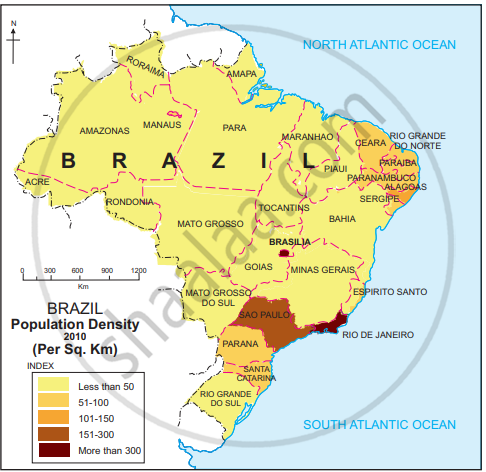
Study the indices of density maps of both the countries. What difference do you find? What conclusions can you draw?
|
India Population Density |
|
Population density in Brazil |
Balbharati solutions for जियोग्राफी [अंग्रेजी] कक्षा १० महाराष्ट्र राज्य बोर्ड 6 Population Exercise [Page 45]
Is the following sentence right or wrong? Correct the wrong one.
Literacy rate is higher in Brazil than India.
Right
Wrong
Is the following sentence right or wrong? Correct the wrong one.
Right
Wrong
Is the following sentence right or wrong? Correct the wrong one.
The life expectancy of Indians is decreasing.
Right
Wrong
Is the following sentence right or wrong? Correct the wrong one.
The north-western part of India is densely populated.
Is the following sentence right or wrong? Correct the wrong one.
The western part of Brazil is densely populated.
Answer the questions as per the instructions:
Arrange the following states of India in descending order of their population.
Himachal Pradesh, Uttar Pradesh, Arunachal Pradesh, Madhya Pradesh, Andhra Pradesh.
Arrange the states of Brazil in ascending order of their population.
Amazonas, Rio de Janeiro, Alaguas, Sao Paulo, Parana
Classify the factors affecting the distribution of population into favourable and unfavourable.
Nearness to sea, lack of roads, temperate climate, lack of industries, new cities and towns, tropical moist forests, minerals, semi-arid climate, cultivable land.
Answer the following questions:
Explain the similarities between the population distribution in Brazil and India.
Explain the differences between the population distribution in Brazil and India.
Giving examples, correlate climate and population distribution.
Give geographical reasons.
Population is an important resource.
Give geographical reasons.
Brazil’s population density is very less.
Give geographical reasons.
India’s population density is high.
Give geographical reasons.
The density of population is sparse in Amazon basin.
Give geographical reasons.
Population density is high in the Ganga plains.
- Compare and classify the population densities shown in the squares ‘a’ and ‘b’ representing 1 sq. km of area.
- If in figure B, one sign = 100, then what will be the sex ratio?
(a)
(b)
Comment upon the population density of the figure.
Activity:
Obtain the talukawise data of your district’s population and show it with the help of a dot map.
Solutions for 6: Population
Balbharati solutions for जियोग्राफी [अंग्रेजी] कक्षा १० महाराष्ट्र राज्य बोर्ड chapter 6 - Population
Shaalaa.com has the Maharashtra State Board Mathematics जियोग्राफी [अंग्रेजी] कक्षा १० महाराष्ट्र राज्य बोर्ड Maharashtra State Board solutions in a manner that help students grasp basic concepts better and faster. The detailed, step-by-step solutions will help you understand the concepts better and clarify any confusion. Balbharati solutions for Mathematics जियोग्राफी [अंग्रेजी] कक्षा १० महाराष्ट्र राज्य बोर्ड Maharashtra State Board 6 (Population) include all questions with answers and detailed explanations. This will clear students' doubts about questions and improve their application skills while preparing for board exams.
Further, we at Shaalaa.com provide such solutions so students can prepare for written exams. Balbharati textbook solutions can be a core help for self-study and provide excellent self-help guidance for students.
Concepts covered in जियोग्राफी [अंग्रेजी] कक्षा १० महाराष्ट्र राज्य बोर्ड chapter 6 Population are Population in Brazil, Population Composition of Brazil and India> Age and Sex Pyramid, Population of India, Population Composition of Brazil and India> Sex Ratio, Population Composition of Brazil and India> Population Growth Rate, Population Composition of Brazil and India> Life Expectancy, Population Composition of Brazil and India> Literacy Rate.
Using Balbharati जियोग्राफी [अंग्रेजी] कक्षा १० महाराष्ट्र राज्य बोर्ड solutions Population exercise by students is an easy way to prepare for the exams, as they involve solutions arranged chapter-wise and also page-wise. The questions involved in Balbharati Solutions are essential questions that can be asked in the final exam. Maximum Maharashtra State Board जियोग्राफी [अंग्रेजी] कक्षा १० महाराष्ट्र राज्य बोर्ड students prefer Balbharati Textbook Solutions to score more in exams.
Get the free view of Chapter 6, Population जियोग्राफी [अंग्रेजी] कक्षा १० महाराष्ट्र राज्य बोर्ड additional questions for Mathematics जियोग्राफी [अंग्रेजी] कक्षा १० महाराष्ट्र राज्य बोर्ड Maharashtra State Board, and you can use Shaalaa.com to keep it handy for your exam preparation.
