Advertisements
Advertisements
The total area of the histogram is _________ to the total frequency of the given data
Concept: undefined >> undefined
A graph that displays data that changes continuously over the periods of time is _________
Concept: undefined >> undefined
Advertisements
Histogram is a graphical representation of ___________ data
Concept: undefined >> undefined
In a village, there are 570 people who have cell phones. An NGO survey their cell phone usage. Based on this survey a histogram is drawn
How many people use the cell phone for less than 3 hours?
Concept: undefined >> undefined
In a village, there are 570 people who have cell phones. An NGO survey their cell phone usage. Based on this survey a histogram is drawn
How many of them use the cell phone for more than 5 hours?
Concept: undefined >> undefined
In a village, there are 570 people who have cell phones. An NGO survey their cell phone usage. Based on this survey a histogram is drawn
Are people using cell phone for less than 1 hour?
Concept: undefined >> undefined
Draw a histogram for the following data.
| Class Interval | 0 − 10 | 10 − 20 | 20 − 30 | 30 − 40 | 40 − 50 | 50 − 60 |
| No. of students | 5 | 15 | 23 | 20 | 10 | 7 |
Concept: undefined >> undefined
Construct a histogram from the following distribution of total marks of 40 students in a class.
| Marks | 90 − 110 | 110 − 130 | 130 − 150 | 150 − 170 | 170 − 190 | 190 − 210 |
| No. of Students | 9 | 5 | 10 | 7 | 4 | 6 |
Concept: undefined >> undefined
The marks obtained by 50 students in Mathematics are given below.
(i) Make a frequency distribution table taking a class size of 10 marks
(ii) Draw a histogram and a frequency polygon.
| 52 | 33 | 56 | 52 | 44 | 59 | 47 | 61 | 49 | 61 |
| 47 | 52 | 67 | 39 | 89 | 57 | 64 | 58 | 63 | 65 |
| 32 | 64 | 50 | 54 | 42 | 48 | 22 | 37 | 59 | 63 |
| 36 | 35 | 48 | 48 | 55 | 62 | 74 | 43 | 41 | 51 |
| 08 | 71 | 30 | 18 | 43 | 28 | 20 | 40 | 58 | 49 |
Concept: undefined >> undefined
The graphical representation of ungrouped data is ________
Concept: undefined >> undefined
Histogram is a graph of a ________ frequency distribution
Concept: undefined >> undefined
The graphical representation of grouped data is _________
Concept: undefined >> undefined
Draw a histogram for the given frequency distribution
| Age | 41 − 45 | 46 − 50 | 51 − 55 | 56 − 60 | 61 − 65 | 66 − 70 | 71 − 75 |
| Frequency | 4 | 9 | 17 | 25 | 15 | 8 | 2 |
Concept: undefined >> undefined
Draw a histogram and the frequency polygon in the same diagram to represent the following data
| Weight (in kg) | 50 − 55 | 56 − 61 | 62 − 67 | 68 − 73 | 74 − 79 | 80 − 85 | 86 − 91 |
| No. of persons | 15 | 8 | 12 | 17 | 9 | 10 | 6 |
Concept: undefined >> undefined
Form a continuous frequency distribution table and draw histogram from the following data.
| Age (in years) | No. of persons |
| Under 5 | 1 |
| Under 10 | 12 |
| Under 15 | 19 |
| Under 20 | 26 |
| Under 25 | 27 |
| Under 30 | 35 |
| Under 35 | 38 |
| Under 40 | 45 |
| Under 45 | 48 |
| Under 50 | 53 |
Concept: undefined >> undefined
Draw a histogram for the following data.
| Mid Value (x) | 15 | 25 | 35 | 45 | 55 | 65 | 75 |
| Frequency (f) | 12 | 24 | 30 | 18 | 26 | 10 | 8 |
Concept: undefined >> undefined
With his usual speed, if a person covers a circular track of radius 150 m in 9 minutes, find the distance that he covers in 3 minutes (π = 3.14)
Concept: undefined >> undefined
Find the area of the house drawing given in the figure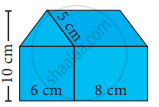
Concept: undefined >> undefined
In the given figure, AC ≡ AD and ∠CBD ≡ ∠DEC. Prove that ∆BCF ≡ ∆EDF.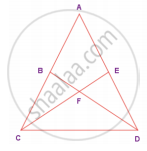
Concept: undefined >> undefined
The distribution of heights (in cm) of 100 people is given below. Construct a histogram and the frequency polygon imposed on it.
| Height (in cm) |
125 − 135 | 136 − 146 | 147 − 157 | 158 − 168 | 169 − 179 | 180 − 190 | 191 − 201 |
| Frequency | 12 | 22 | 18 | 24 | 15 | 7 | 2 |
Concept: undefined >> undefined
