Please select a subject first
Advertisements
Advertisements
Explain how temperature affects the following.
The density of sea water
Concept: undefined >> undefined
Write the correct word - Import or Export for the following:
India buys crude oil from the Middle-East Asian countries.
Concept: undefined >> undefined
Advertisements
Correct and rewrite the wrong statement:
International trade processes are easier than local trade.
Concept: undefined >> undefined
Correct and rewrite the wrong statement:
SAARC works towards economic development and enhancing the social and cultural harmony of the South-East Asian countries.
Concept: undefined >> undefined
What is the difference between the OPEC and APEC in terms of their functions?
Concept: undefined >> undefined
In the following table, export-import of some countries in the year 2014-15 is given in million U.S. dollars. Make a compound bar graph of the given statistical information. Read the bar diagram carefully and comment upon the balance of payments of the respective countries.
| Country | Export | Import |
| China | 2143 | 1960 |
| India | 272 | 380 |
| Brazil | 190 | 241 |
| USA | 1510 | 2380 |
Concept: undefined >> undefined
Suggest measures for the following problem:
The slums in the cities are increasing.
Concept: undefined >> undefined
Suggest measures for the following problem.
Because of the increasing traffic jams within the city, lot of time is consumed in commuting.
Concept: undefined >> undefined
Suggest measures for the following problem:
The question of law and order in the urban areas is serious.
Concept: undefined >> undefined
Suggest measures for the following problem:
The problem of pollution is grave because of urbanisation.
Concept: undefined >> undefined
Compare the following and give an example:
Transportation system and traffic jams
Concept: undefined >> undefined
Compare the following and give example:
Migration and slums
Concept: undefined >> undefined
Explain:
Pollution- A problem
Concept: undefined >> undefined
Visit a big city near your village and write the facilities and problems you come across with the help of your teacher.
Concept: undefined >> undefined
Using the statistical information given in the table below, draw a line graph of the percentage of urban population using computer. Discuss in terms of urbanisation. After studying this graph, write the conclusions about urbanisation in our country from 1961-2011 in your own words.
| S. No. |
Year | (Percentage) | No of urban settlements |
| 1 | 1961 | 17.79 | 2,270 |
| 2 | 1971 | 19.11 | 3,576 |
| 3 | 1981 | 23.34 | 3,245 |
| 4 | 1991 | 25.72 | 3,605 |
| 5 | 2001 | 28.06 | 5,161 |
| 6 | 2011 | 37.07 | 7,935 |
Concept: undefined >> undefined
Suggest measures for the following problem of urbanisation shown in the following picture.
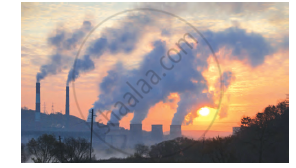
Concept: undefined >> undefined
Suggest measures for the following problem of urbanisation shown in the following picture.
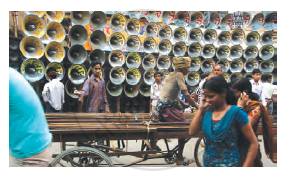
Concept: undefined >> undefined
Suggest measures for the following problem of urbanisation shown in the following picture.

Concept: undefined >> undefined
