Advertisements
Advertisements
Give geographical reason.
The Barren Island is becoming conical in shape.
Concept: undefined >> undefined
Show the following on a given outline map of the world.
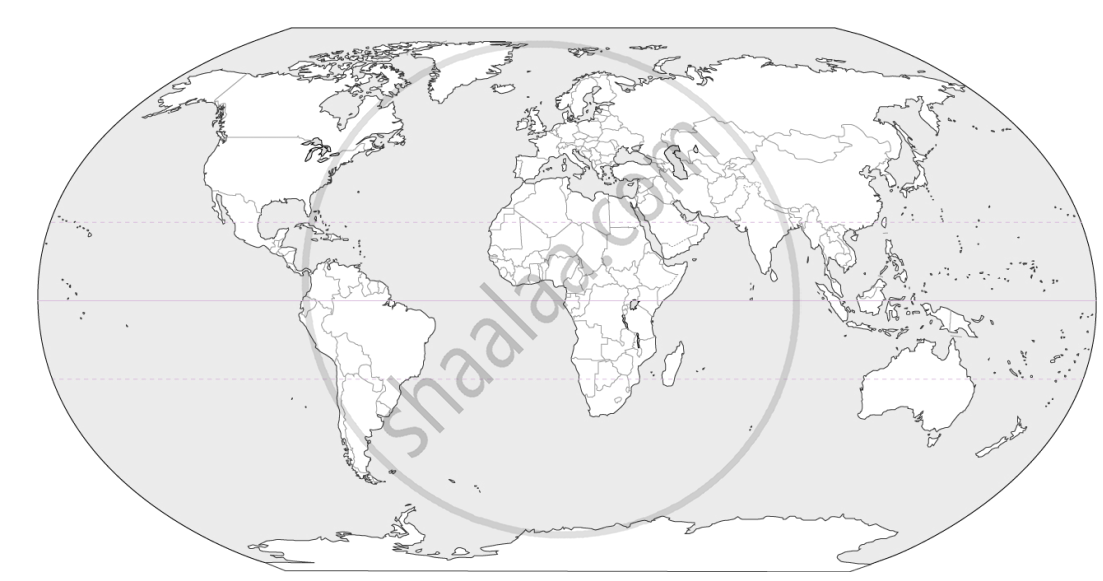
- Mt. Kilimanjaro
- Mid-Atlantic Earthquake zone
- Mt. Fuji
- Krakatoa
- Mt. Vesuvius
Concept: undefined >> undefined
Advertisements
Write whether the statement are true or false. Correct the incorrect one.
Climate affects earthquakes.
Concept: undefined >> undefined
Using the internet, look for incidences of a few landslides that have occurred in India and write about them briefly.
Concept: undefined >> undefined
Observe the following picture carefully. Identify the landforms formed by different agents of erosion. Number them with pencil here and write their names in the sequence in your notebook.
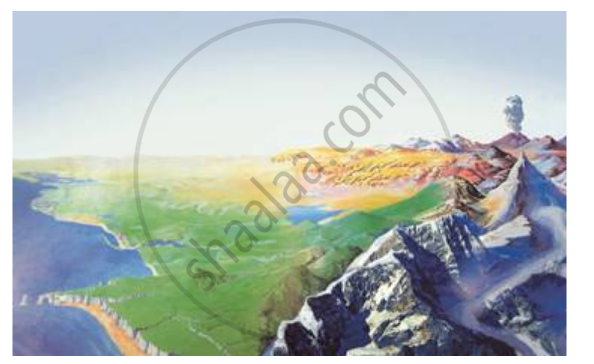
Concept: undefined >> undefined
Give reason.
There are more salt-pans on the Western coast of India than its eastern coast.
Concept: undefined >> undefined
Explain the distribution of salinity around the Tropic of Cancer and tropic of Capricorn.
Concept: undefined >> undefined
Name the factors affecting salinity.
Concept: undefined >> undefined
Give reasons why the following sentence is right or wrong:
The main aim of distributional maps is to show location.
Concept: undefined >> undefined
Give reasons why following sentence is right or wrong:
In dot method, every dot should have an appropriate scale.
Concept: undefined >> undefined
Give reasons why following sentence is right or wrong:
Distribution of various geographical elements can be shown using dot method.
Concept: undefined >> undefined
Explain with reasons the method which is best suited to show the distribution of population in a region.
Concept: undefined >> undefined
Which method will you use for the following information?
Talukawise wheat production in the district
Concept: undefined >> undefined
Which method will you use for the following information?
Distribution of domestic animals in the State.
Concept: undefined >> undefined
Study the population distribution map of Kolhapur district and answer the following questions:
- Which method has been used to show the distribution of population in the district?
- Explain the directionwise distribution of the population from dense to sparse.
- What is the population shown by the largest circle? Which place is that?
- Which Taluka has the least population?

Concept: undefined >> undefined
Now we will prepare a map using dot method. Carry out the following activity.
- See the map of Nandurbar given in fig. carefully. Draw it on another paper or tracing paper along with its taluka and district boundaries.
- Now see the population table given along the map. On the basis of the statistical data, decide the value of the dots considering the highest and the lowest values of population. For example, 1 dot = 10000 people, so you can decide how many dots to be given to each sub-administrative unit.
- To draw dots of the uniform size, take a ball pen refill. Close the back end of the refill with cotton. Press this end on a stamp-pad and draw the imprints of the dots wherever required.
- While placing the dots, consider the physiography, water sources, roads, rails, taluka and district headquarters as shown in the map in fig
- Compare your dot map with other students and arrange a discussion in the class

| S.No. | Talukas | Rural Population 2011 |
| 1. | Akkalkuwa | 2,15,974 |
| 2. | Akrani | 1,89,661 |
| 3. | Taloda | 1,33,291 |
| 4. | Shahada | 3,46,352 |
| 5. | Nandurbar | 2,56,409 |
| 6. | Nawapur | 2,31,134 |
Concept: undefined >> undefined
On which of the following are slow movements in the earth’s interior dependent?
Concept: undefined >> undefined
When waves divert from each other, what do they create?
Concept: undefined >> undefined
Give geographical reason.
There is a difference in the formation of the Meghalaya Plateau and the Deccan Plateau.
Concept: undefined >> undefined
Identify and name the internal movement.
The Himalayas are an example of fold mountains.
Concept: undefined >> undefined
