Advertisements
Advertisements
Fiscal policy helps the government of a country to control the flow of ______.
Concept: undefined >> undefined
In which of the following years was the Reserve Bank of India nationalised?
Concept: undefined >> undefined
Advertisements
Which two banks were merged with Bank of Baroda with effect from 1st April 2019?
Concept: undefined >> undefined
Which of the following bodies recommends nummum support price for crops?
Concept: undefined >> undefined
When was Reserve Bank of India established?
Concept: undefined >> undefined
In the First Five Year Plan ______, the Government of India sought to get the country's economy out of the cycle of poverty.
Concept: undefined >> undefined
Select the option figure that will replace the question mark (?) in the figure given below to complete the pattern.

Concept: undefined >> undefined
Study the graph and answer the question given below.
The given graph represents the number of workers getting daily wages (in ₹).
Total number of workers = 200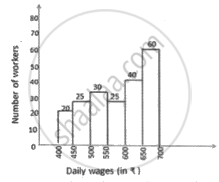
The total number of workers whose daily wages are less than ₹ 550 is what percentage less than the total number of workers whose daily wages are ₹ 550 and above?
Concept: undefined >> undefined
The year-wise student enrollment of two schools over a period of 5 years has been presented in the following bar graph.

In which year is the difference of enrollment in the two schools, the least?
Concept: undefined >> undefined
Study the following bar graph and answer the question given below.
The given bar graph represents the total number of applications received for the B.Com course by two different colleges A and B, in five different years.
The difference between the average number of applications received by college A from 2015 to 2019 and the average number of applications received by college B from 2015 to 2019 is:
Concept: undefined >> undefined
Three cubes each having volume 1728 cm3 are placed one above the other. What is the total surface area of the resulting solid?
Concept: undefined >> undefined
The following graph shows the production of cotton cloth (in lakh metres) by three companies A, B and C over the years 1996 - 2000.
The production of company A during (1996 - 98) is what percentage of the average production of companies B and C during 1998 - 2000 (correct to two decimal places)?
Concept: undefined >> undefined
Select the option that can replace the question mark (?) and complete the given figure.

Concept: undefined >> undefined
The Cabinet Committee on Economic Affairs (CCEA) increased the Minimum Support Prices (MSPs) of cotton (long staple) to ₹ _______ per quintal for marketing season 2020-21.
Concept: undefined >> undefined
Select the option figure, which when placed in the blank space of the figure marked 'X' complete the paltern.
(X)
Concept: undefined >> undefined
Study the following histogram and answer the questions given below: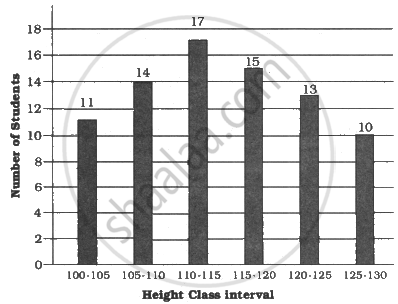
In the given histogram, what is the mean height of all students correct to one decimal place?
Concept: undefined >> undefined
The given bar chart shows the details of cycle sales by a company between January and May for years 2017 and 2018.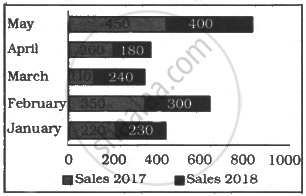
In the given bar chart, which month's sale shows the maximum decrease in 2018 as compared to 2017?
Concept: undefined >> undefined
The bar chart given below snows the percentage distribution of the production of various models of a mobile manufacturing company in 2007 and 2008. The total production in 2007 was 35 Lakh mobile phones and in 2008 the production was 44 lakh. Study the chart and answer the following questions.
Percentage of six different types of mobiles manufactured by a company over two years.
For which models was the percentage variation in production from 2007 to 2008 the maximum?
Concept: undefined >> undefined
The sub divided bar diagram given below depicts H.S. Students of a school for three years. Study the diagram and answer the questions.
In which year the school had the best result for H.S. in respect of percentage of pass candidates?
Concept: undefined >> undefined
Study the following Histogram and answer the following questions.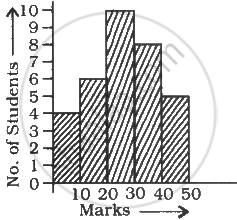
The least number of students got the marks in the interval
Concept: undefined >> undefined
