Advertisements
Advertisements
प्रश्न
Study the graph and answer the question given below.
The given graph represents the number of workers getting daily wages (in ₹).
Total number of workers = 200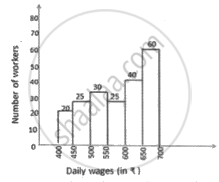
The total number of workers whose daily wages are less than ₹ 550 is what percentage less than the total number of workers whose daily wages are ₹ 550 and above?
विकल्प
50%
60%
40%
45%
MCQ
Advertisements
उत्तर
40%
Explanation:
No. of workers whose daily wages are less than ₹ 550
= 20 + 25 + 30 = 75
No. of workers whose daily wages are ₹ 550 and above
= 25 + 40 + 60 = 125
So, No. of workers whose daily wages are less than ₹ 550 is less than the number of workers whose daily wages are ₹ 550 and above = 125 – 75 = 50
∴ Percentage = `50/125 xx 100` = 40%
shaalaa.com
Data Interpretation (Entrance Exam)
क्या इस प्रश्न या उत्तर में कोई त्रुटि है?
