Advertisements
Advertisements
The mean deviation for n observations \[x_1 , x_2 , . . . , x_n\] from their mean \[\bar{X} \] is given by
Concept: undefined >> undefined
Let \[x_1 , x_2 , . . . , x_n\] be n observations and \[X\] be their arithmetic mean. The standard deviation is given by
Concept: undefined >> undefined
Advertisements
If second, third and sixth terms of an A.P. are consecutive terms of a G.P., write the common ratio of the G.P.
Concept: undefined >> undefined
Write the quadratic equation the arithmetic and geometric means of whose roots are Aand G respectively.
Concept: undefined >> undefined
If a, b, c are in A.P. and x, y, z are in G.P., then the value of xb − c yc − a za − b is
Concept: undefined >> undefined
The first three of four given numbers are in G.P. and their last three are in A.P. with common difference 6. If first and fourth numbers are equal, then the first number is
Concept: undefined >> undefined
If a, b, c are in G.P. and a1/x = b1/y = c1/z, then xyz are in
Concept: undefined >> undefined
If odds against an event be 7 : 9, find the probability of non-occurrence of this event.
Concept: undefined >> undefined
If odds in favour of an event be 2 : 3, find the probability of occurrence of this event.
Concept: undefined >> undefined
Solve the following problem.
Obtain a derivative of the following function: x sin x
Concept: undefined >> undefined
Two finite sets have m and n elements respectively. The total number of subsets of first set is 56 more than the total number of subsets of the second set. The values of m and n respectively are ______.
Concept: undefined >> undefined
If A and B are two finite sets, then n(A) + n(B) is equal to ______.
Concept: undefined >> undefined
If A is a finite set containing n element, then number of subsets of A is ______.
Concept: undefined >> undefined
Two finite sets have m and n elements. The number of subsets of the first set is 112 more than that of the second set. The values of m and n are, respectively ______.
Concept: undefined >> undefined
If A and B are finite sets such that A ⊂ B, then n (A ∪ B) = ______.
Concept: undefined >> undefined
Which of the following is not correct?
Concept: undefined >> undefined
Find the linear inequalities for which the shaded region in the given figure is the solution set.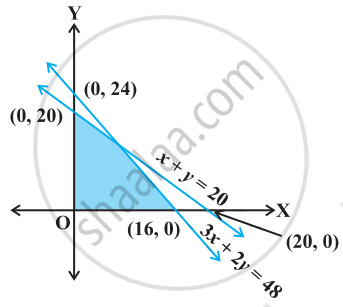
Concept: undefined >> undefined
State which of the following statement is True or False.
If x < y and b < 0, then `x/"b" < y/"b"`
Concept: undefined >> undefined
State which of the following statement is True or False.
If xy > 0, then x > 0 and y < 0
Concept: undefined >> undefined
State which of the following statement is True or False.
If xy > 0, then x < 0 and y < 0
Concept: undefined >> undefined
