Advertisements
Advertisements
प्रश्न
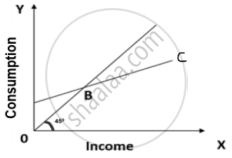
With reference to the given diagram, which of the following is true at point B?
विकल्प
Slope of Consumption Curve = 0
Average Propensity to Consume = 0
Slope of Saving Curve = 1
Average Propensity to Consume = 1
MCQ
Advertisements
उत्तर
Average Propensity to Consume = 1
Explanation:
At point B, consumption and income are exactly equal. There is no saving or dissaving at this point; therefore, the Average Propensity to Consume (APC) = 1. Every unit of income earned is completely spent on consumption, showing a perfect balance of income and expenditure.
shaalaa.com
क्या इस प्रश्न या उत्तर में कोई त्रुटि है?
