Advertisements
Advertisements
प्रश्न
Answer the question based on the information given in the following table. A, B, C, D, E denote companies and 2006, 2007, 2008. 2009& 2010 denote years.
| A | B | C | D | E | ||||||
| M | S | M | S | M | S | M | S | M | S | |
| 2006 | 2.8 | 1.3 | 3.3 | 2.2 | 2.6 | 1.7 | 3.0 | 2.2 | 1.9 | 1.4 |
| 2007 | 3.2 | 2.0 | 2.4 | 1.6 | 2.2 | 1.5 | 2.5 | 1.9 | 2.0 | 1.7 |
| 2008 | 1.9 | 0.9 | 2.9 | 1.6 | 2.1 | 1.0 | 2.3 | 1.5 | 1.6 | 1.1 |
| 2009 | 1.0 | 0.4 | 2.4 | 1.3 | 2.8 | 1.4 | 2.1 | 1.2 | 3.2 | 2.5 |
| 2010 | 2.5 | 1.5 | 2.3 | 1.2 | 2.6 | 2.1 | 1.8 | 1.1 | 3.1 | 2.6 |
What is the total number of units manufactured by company C over me years together?
विकल्प
1420
1030
1230
1320
Advertisements
उत्तर
1230
Explanation:
Total number of units manufactured by company C over all the years together
= 2.6 + 2.2 + 2.1 + 2.8 + 2.6
= 12.3 hundred = 12.3 × 100 = 1230
APPEARS IN
संबंधित प्रश्न
Direction: Answer the question on the basis of the information given below.
The following information is about the consumption of bread in five towns - A, B, C, D and E. Town A consumes a quarter of the total quantity of bread sold in all the five cities. The bread consumption of Town B is one-fourth of the consumption of Town C. The bread consumption of Town D is 12% of the total whereas Town E consumes 23% of the total.
There are only two companies - Bonbon and Modern - that sell bread in these five towns. The bar graph shows the sales of Bon-bon as a percentage of the total sale of bread in each city.
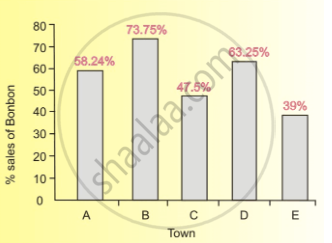
What was the total consumption of Bonbon bread in Towns A and B during a particular week when the total consumption of bread in Town D was 3600 loaves?
Answer the question based on the information given in the following table. A, B, C, D, E denote companies and 2006, 2007, 2008. 2009& 2010 denote years.
| A | B | C | D | E | ||||||
| M | S | M | S | M | S | M | S | M | S | |
| 2006 | 2.8 | 1.3 | 3.3 | 2.2 | 2.6 | 1.7 | 3.0 | 2.2 | 1.9 | 1.4 |
| 2007 | 3.2 | 2.0 | 2.4 | 1.6 | 2.2 | 1.5 | 2.5 | 1.9 | 2.0 | 1.7 |
| 2008 | 1.9 | 0.9 | 2.9 | 1.6 | 2.1 | 1.0 | 2.3 | 1.5 | 1.6 | 1.1 |
| 2009 | 1.0 | 0.4 | 2.4 | 1.3 | 2.8 | 1.4 | 2.1 | 1.2 | 3.2 | 2.5 |
| 2010 | 2.5 | 1.5 | 2.3 | 1.2 | 2.6 | 2.1 | 1.8 | 1.1 | 3.1 | 2.6 |
What is the approximate percent increase in the number of units sold by Company E in the year 2007 from the previous year?
The pie chart below shows the Indian Government’s interim budget allocation for the year 2019-2020 in percentage terms. All the questions below should be answered solely based on the pie chart below.

If the Government’s budgetary allocation for ‘Pension’ is Rs. 1.7 lakh crore, which of the following is the closest approximation of the total budget amount of the Government?
The pie chart below shows the Indian Government’s interim budget allocation for the year 2019-2020 in percentage terms. All the questions below should be answered solely based on the pie chart below.
If the entire portion of the budget earmarked for Defence is split equally between ‘Transport’ and ‘Home Affairs’, what would be the new allocations for ‘Transport’ and ‘Home Affairs’ in percentage terms?
Slope of straight line is referred as
Types of frequency distribution are
Most frequent occurring observation in data is called
Maximum value in class limit is called
Difference between maximum and minimum observation is called
Minimum and maximum values defined for a class or group is called
