Advertisements
Advertisements
प्रश्न
- Use the information given in the adjoining histogram to construct a frequency table.
- Use this table to construct an ogive.

आलेख
Advertisements
उत्तर
a.
| Class Interval | Frequency | c.f. |
| 8 – 12 | 9 | 9 |
| 12 – 16 | 16 | 25 |
| 16 – 20 | 22 | 47 |
| 20 – 24 | 18 | 65 |
| 24 – 28 | 12 | 77 |
| 28 – 32 | 4 | 81 |
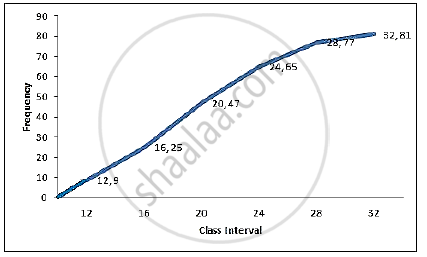
b. Now plot the points (12, 9), (16, 25), (20, 47), (24, 65), (28, 77), (32, 81) and join them to obtain an ogive.
shaalaa.com
क्या इस प्रश्न या उत्तर में कोई त्रुटि है?
