Advertisements
Advertisements
प्रश्न
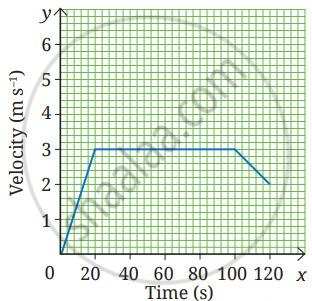
The velocity-time graph from 0 s to 120 s for a cyclist is shown in the Fig. Shade the areas (in different colours) representing the displacement of the cyclist
- while cyclist is moving with constant velocity.
- when the velocity of cyclist is decreasing.
Also, calculate the displacement and average acceleration in the 120 s time interval.
Advertisements
उत्तर
(i) Constant Velocity: Shade the rectangular area between t =20 s and t = 100 s
(ii) Decreasing Velocity: Shade the trapezoidal area between t = 100 s and t = 120 s (where the line slopes downward).
Displacement Calculation (Total Area under the Graph):
Area 1 (Triangle, 0 – 20s):
`1/2 xx 20 xx 3`
= 30 m
Area 2 (Rectangle, 20 – 100s):
length × width
= 80 × 3
= 240 m
Area 3 (Trapezium, 100 – 120s):
`1/2 xx (3 + 2) xx 20`
= 50 m
Total Displacement: 30 + 240 + 50 = 320 m
Average Acceleration = `["Final velocity − Initial Velocity"/"Total Time"]`
= `(2 - 0)/120`
= `1/60` m/s2
