Advertisements
Advertisements
प्रश्न
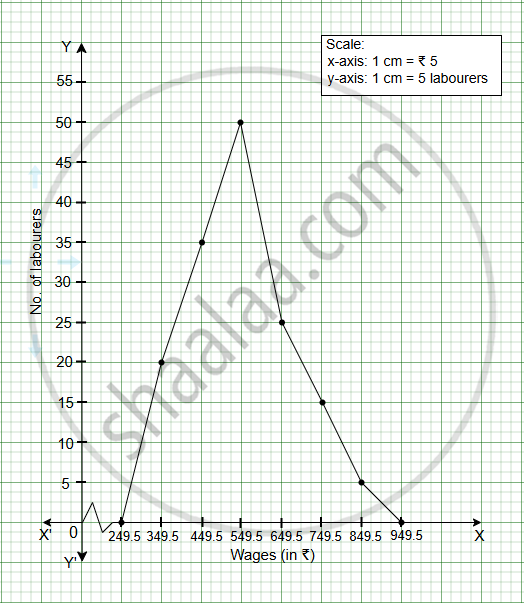
The table given below shows the daily wages of labourers in a factory.
| Wages (in ₹) | 300 - 399 | 400 - 499 | 500 - 599 | 600 - 699 | 700 - 799 | 800 - 899 |
| No. of labourers | 20 | 35 | 50 | 25 | 15 | 5 |
Draw a frequency polygon to represent the above data.
आलेख
Advertisements
उत्तर
Mid-value = `"upper limit + lower limit"/2`
| Wages (in ₹) | Mid-value | No. of labourers |
| 300 - 399 | 349.5 | 20 |
| 400 - 499 | 449.5 | 35 |
| 500 - 599 | 549.5 | 50 |
| 600 - 699 | 649.5 | 25 |
| 700 - 799 | 749.5 | 15 |
| 800 - 899 | 849.5 | 5 |
shaalaa.com
क्या इस प्रश्न या उत्तर में कोई त्रुटि है?
