Advertisements
Advertisements
प्रश्न
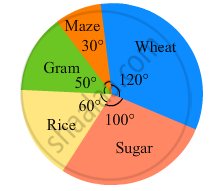
The pie-chart given in the following shows the annual agricultural production of an Indian state. If the total production of all the commodities is 81000 tonnes, find the production (in tonnes) of
(i) Wheat
(ii) Sugar
(iii) Rice
(iv) Maize
(v) Gram
Advertisements
उत्तर
(i) \[\text{ Production of wheat }= \frac{\text{ Central angle for wheat }\times\text{ Total production }}{360^\circ}\]
\[ = \frac{120^\circ \times 81000}{360^\circ} = 27000\text{ tonnes }\]
(ii)\[\text{ Production of sugar }= \frac{\text{ Central angle for sugar }\times\text{ Total production }}{360^\circ}\]
\[ = \frac{10^\circ \times 81000}{360^\circ} = 22500\text{ tonnes }\]
(iii) \[\text{ Production of rice }= \frac{\text{ Central angle for Rice }\times\text{ Total production }}{360^\circ}\]
\[ = \frac{60^\circ \times 81000}{360^\circ} = 13500\text{ tonnes }\]
(iv) \[\text{ Production of maize }= \frac{\text{ Central angle for maize }\times\text{ Total production }}{360^\circ}\]
\[ = \frac{30^\circ \times 81000}{360^\circ} = 6750\text{ tonnes }\]
(v) \[\text{ Production of gram }= \frac{\text{ Central angle for Gram }\times\text{ Total production }}{360^\circ}\]
\[ = \frac{120^\circ \times 81000}{360^\circ} = 11250\text{ tonnes }\]
