Advertisements
Advertisements
प्रश्न
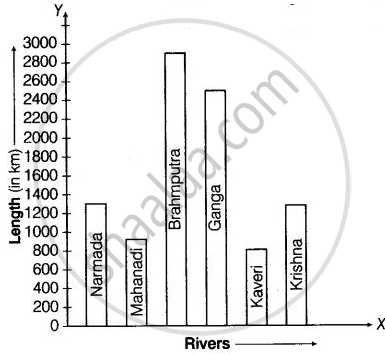
The lengths in km (rounded to nearest hundred) of some major rivers of India is given below:
| River | Length (in km) |
| Narmada | 1300 |
| Mahanadi | 900 |
| Brahmputra | 2900 |
| Ganga | 2500 |
| Kaveri | 800 |
| Krishna | 1300 |
Draw a bar graph to represent the above information.
Advertisements
उत्तर
In order to construct a bar graph representing the above data, we follow the following steps:
Step I: Take a graph paper and draw two mutually perpendicular lines OX and OY. Let OX as the horizontal axis and OY as the vertical axis.
Step II: Along OX, mark river’s name and along OY, mark length in kilometres.
Step III: Along OX, choose the uniform (equal) width of the bars and the uniform gap between them, according to the space available for the graph.
Step IV: Choose a suitable scale to determine the heights of the bars, according to the availability of space. Here, we choose 1 unit length represents 200 km.
Hence, the required bar graph of given data is shown below
| Name of the river | Height of bars |
| Narmada | `1300/200` = 6.5 units |
| Mahanadi | `900/200` = 4.5 units |
| Brahmputra | `2900/200` = 14.5 units |
| Ganga | `2500/200` = 12.5 units |
| Kaveri | `800/200` = 4 units |
| Krishna | `1300/200` = 6.5 units |
Scale: 1 unit length = 200 km