Advertisements
Advertisements
प्रश्न
|
The graph (fig A) illustrates the correlation between the number of protons (x-axis) and the number of neutrons (y-axis) for elements A, B, C, D, and E in the periodic table. These elements are denoted by the letters rather than their conventional symbols. When the element C, depicted in the graph, undergoes radioactive decay, it releases radioactive rays. When these rays are directed into the plane of the paper in the presence of a magnetic field, as indicated in the fig B, they experience deflection, causing them to move upwards.
|
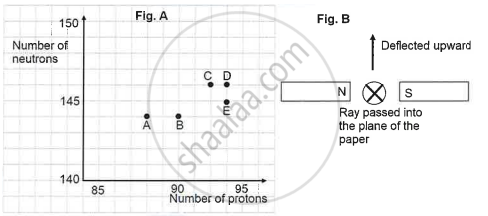
Name the radioactive radiations emitted by the element C.
एक शब्द/वाक्यांश उत्तर
Advertisements
उत्तर
Beta
shaalaa.com
Beta Decay (Beta Emission)
क्या इस प्रश्न या उत्तर में कोई त्रुटि है?
