Advertisements
Advertisements
प्रश्न
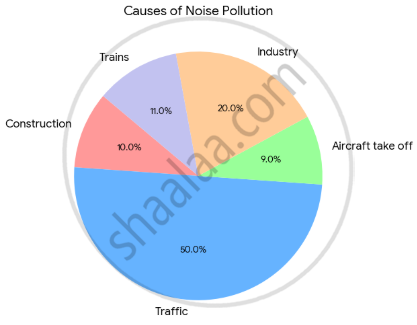
The following table shows causes of noise pollution. Complete the table to draw a pie diagram.
| Causes | Percentage | Central angle |
| Construction | 10% | `square` |
| Traffic | `square` | 180° |
| Aircraft take off | 9% | `square` |
| Industry | 20% | `square` |
| Trains | 11% | 39.6 |
सारिणी
तालिका पूरा करें
Advertisements
उत्तर
1. Construction
Given percentage = 10%
Central angle = `10/100 xx 360^circ = 36^circ`
2. Traffic
Given central angle = 180°
Percentage = `(180^circ)/(360^circ) xx 100 = 50%`
3. Aircraft take off
Given percentage = 9%
Central angle = `9/100 xx 360^circ = 32.4^circ`
3. Industry
Given percentage = 20%
Central angle = `20/100 xx 360^circ = 72^circ`
Completed the table
| Causes | Percentage | Central angle |
| Construction | 10% | \[\boxed{36°}\] |
| Traffic | \[\boxed{50\%}\] | 180° |
| Aircraft take off | 9% | \[\boxed{32.4°}\] |
| Industry | 20% | \[\boxed{72°}\] |
| Trains | 11% | 39.6° |
shaalaa.com
क्या इस प्रश्न या उत्तर में कोई त्रुटि है?
