Advertisements
Advertisements
प्रश्न
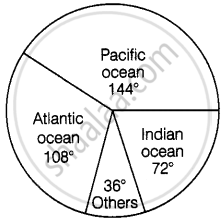
The following data represents the approximate percentage of water in various oceans. Prepare a pie chart for the given data.
| Pacific | 40% |
| Atlantic | 30% |
| Indian | 20% |
| Others | 10% |
सारिणी
Advertisements
उत्तर
| Ocean | Central angle |
| Pacific | `40/100 xx 360^circ = 144^circ` |
| Atlantic | `30/100 xx 360^circ = 108^circ` |
| Indian | `20/100 xx 360^circ = 72^circ` |
| Others | `10/100 xx 360^circ = 36^circ` |
The pie chart is as follows:
shaalaa.com
क्या इस प्रश्न या उत्तर में कोई त्रुटि है?
अध्याय 2: Data Handling - Exercise [पृष्ठ ५८]
