Advertisements
Advertisements
प्रश्न
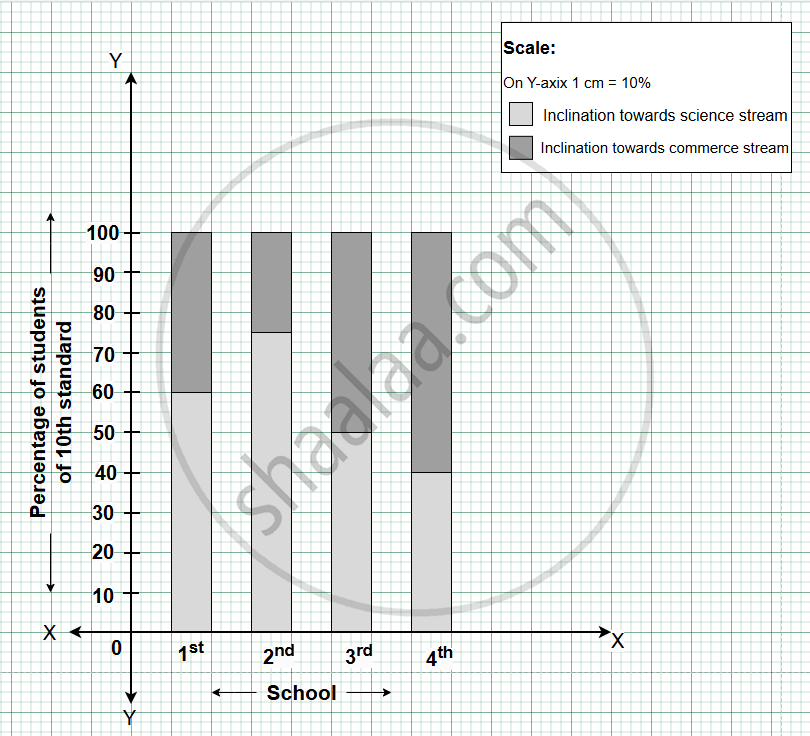
The following data is collected in a survey of some students of 10th standard from some schools. Draw the percentage bar graph of the data.
| School | 1st | 2nd | 3rd | 4th |
| Inclination towards science stream | 90 | 60 | 25 | 16 |
| Inclination towards commerce stream | 60 | 20 | 25 | 24 |
योग
Advertisements
उत्तर
We have,
| School | 1st | 2nd | 3rd | 4th |
| Inclination towards science stream | 90 | 60 | 25 | 16 |
| Inclination towards commerce stream | 60 | 20 | 25 | 24 |
| Total number of students | 150 | 80 | 50 | 40 |
| Percentage of students whose inclination towards science stream | `90/150 xx 100 = 60` | `60/80 xx 100 =75` | 100 - 5`25/50 xx 100 = 50` | `16/40 xx 100 = 40` |
| Percentage of students whose inclination towards commerce stream | 100 - 60 = 40 | 100 - 75 = 25 | 0 = 50 | 100 - 40 = 60 |
The percentage bar graph of the given data is as follows:
shaalaa.com
Percentage Bar Graph
क्या इस प्रश्न या उत्तर में कोई त्रुटि है?
संबंधित प्रश्न
Show the following information by percentage bar graph.
| Division of standard 8 | A | B | C | D |
| Number of students securring grade A | 45 | 33 | 10 | 15 |
| Total number of students | 60 | 55 | 40 | 75 |
Observe the following graph and answer the questions.
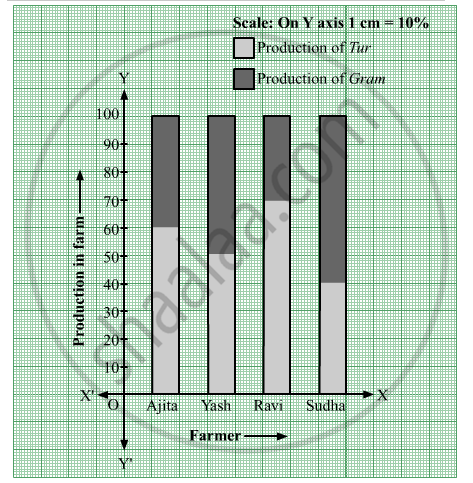
- State the type of the bar graph.
- How much percent is the Tur production to total production in Ajita’s farm?
- Compare the production of Gram in the farms of Yash and Ravi and the state whose percentage of production is more and by how much.
- Whose percentage production of Tur is the least?
- State production percentages of Tur and gram in Sudha's farm.
