Advertisements
Advertisements
प्रश्न
The figure given below shows the relation between the quantity demanded for the good X and the price of the good Z. What type of goods are X and Z?

विकल्प
Unrelated goods
Substitute goods
Complementary goods
Giffen goods
Advertisements
उत्तर
Complementary goods
Explanation:
The price of an item Z and the demand for its complement good X have an inverse relationship. When the price of good Z rises, it reduces not only the demand for good Z, but also the desire for good X. The graph depicts the indirect relationship between the price of Good Z and the demand for Good X. As a result, they are complimentary items.
APPEARS IN
संबंधित प्रश्न
Demand for necessaries is................
(elastic / inelastic / infinitely elastic / unitary elastic)
Any statement above demand for a good is considered complete only when the following is/are mentioned in it. ( choose the correct alternative)
a) Price of the good
b) Quantity of good
c) Period of time
d) All of the above
Demand for a good is termed inelastic through the expenditure approach when if (choose the correct alternative)
a) Price of good falls, expenditure on it rises
b) Price of the good falls, expenditure in it falls
c) Price of the good falls, expenditure on it remains unchanged
d) Price of the good rises, expenditure in it falls
Distinguish between ‘increase in demand’ and increase in quantity demanded of a good.
Demand deposits include (choose the correct alternative)
(a) Saving account deposits and fixed deposits
(b) Saving account deposits and current account deposits
(c) Current account deposits and fixed deposits
(d) All types of deposits
When is demand called perfectly inelastic?
Demand for electricity is elastic.
Fill in the blank using proper alternative given in the bracket:
Perfectly inelastic demand curve is.....................................................
Fill in the blank with appropriate alternatives given in the bracket:
The law of demand states ________ relation between demand and price.
Fill in the blank with appropriate alternatives given below:
Market demand is an aggregate of purchasing by _________ buyers.
State whether the following statement is True or False:
Demand for luxurious goods is elastic .
If the income of a consumer increases, discuss briefly its likely impact on the demand for a inferior good, Good X.
Choose the correct answer from given options
In the given figure X1Y1 and X2Y2 are Production Possibility Curves in two different periods T1 and T2 respectively for Good X and Good Y. A1 and A2 represent actual outputs and P1 and P2 represent potential outputs respectively in the two times periods.
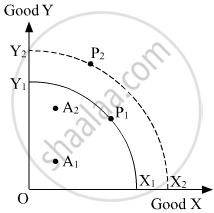
The change in actual output of Goods X and Y over the two periods would be represented by a movement from __________.
Law of demand states the ______ relationship between price and quantity demanded.
Are the concepts of demand for domestic goods and domestic demand for goods the same?
Area under MC curve is equal to:
Read the following news report and answer the Q.97-Q.100 on the basis of the same:
The quantity of a commodity that a consumer is willing to buy and is able to afford, given the prices of goods and the consumer's tastes and preferences is called demand for the commodity. Whenever one or more of these variables change, the quantity of the good Chosen by the consumer is likely to change as well. The relation between the consumer's optimal choice of the quantity of a good and its price is very important and this relation is called the demand function. Thus, the consumer's demand function for a good gives the amount of the good that the consumer chooses at different levels of its price when the other things remain.
What is meant by the contraction of demand?
What is necessary for want to become demand?
Demand must always be expressed along with ______.
