हिंदी
सी.आई.एस.सी.ई.आईसीएसई ICSE Class 6

The Column Graph, Given Above, Shows the Number of Patients, Examined by Dr. V.K. Bansal, on Different Days of a Particular Week.

Advertisements
Advertisements

प्रश्न

The column graph, given above, shows the number of patients, examined by Dr. V.K. Bansal, on different days of a particular week.

Use the graph to answer the following:

On which day were the least number of patients examined?

आलेख
एक पंक्ति में उत्तर
Advertisements

उत्तर
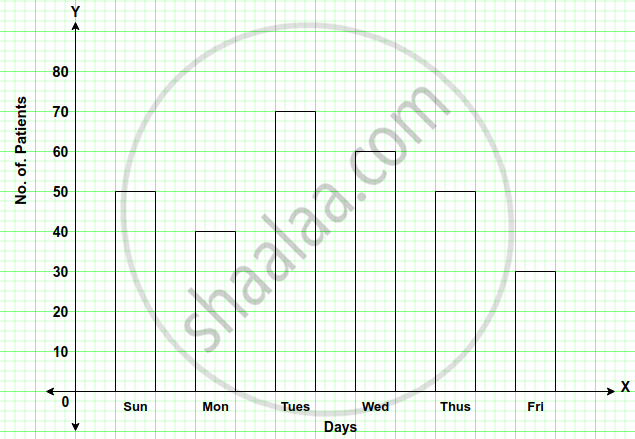
Friday were the least number of patients examined.

shaalaa.com
  क्या इस प्रश्न या उत्तर में कोई त्रुटि है?
अध्याय 22: Data Handling (Including Mean and Median) - Exercise 33 (C)

APPEARS IN

सेलिना Concise Mathematics [English] Class 6 ICSE
अध्याय 22 Data Handling (Including Mean and Median)
Exercise 33 (C) | Q 9.2
Share
Notifications

Englishहिंदीमराठी


      Forgot password?
Use app×