Advertisements
Advertisements
प्रश्न
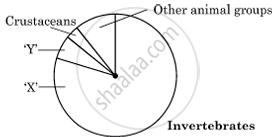
Study the pie chart given below, representing the global biodiversity and proportionate number of species of major taxa.
Answer the following questions:
- Identify ‘X’ and ‘Y’ in the given pie chart.
- Which one of the two ‘X’ or ‘Y’, is the most species-rich taxonomic group and by what percentage?
- Name the level of Biodiversity represented by the following:
- Estuaries and alpine meadows in India
- The medicinal plant Rauwolfia vomitoria.
लघु उत्तरीय
Advertisements
उत्तर
- In the given pie chart, ‘X’ represents Insects. ‘Y’ represents Molluscs.
- Insects (X) are the most diverse taxonomic category, making up almost 70% of the total [no percentage provided in the pie chart].
-
- Estuaries and alpine meadows in India represent ecological diversity.
- The medicinal plant Rauwolfia vomitoria represents genetic diversity.
shaalaa.com
क्या इस प्रश्न या उत्तर में कोई त्रुटि है?
