हिंदी

Study the Graph Given Below and Answer the Questions that Follow - Biology

Advertisements
Advertisements

प्रश्न

Study the graph given below and answer the questions that follow :

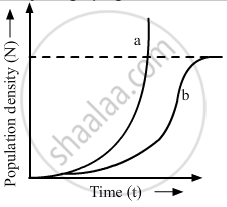
(i) Write the status of food and space in the curves (a) and (b).
(ii) In the absence of predators, which one of the two curves would appropriately depict the prey population?
(iii) Time has been shown on X-axis and there is a parallel dotted line above it. Give the significance of this dotted line

Advertisements

उत्तर

(i) There is ample food and space for the population depicted by curve (a). When the resources are unlimited, the curve is exponential. There are limiting food and space for the population depicted by curve (b). When the resources are limiting, the curve becomes sigmoid.


(ii) In the absence of predators, curve (a) would appropriately depict the prey population.


(iii) The dotted line represents the carrying capacity of the environment. The carrying capacity represents the size of population that the environment can hold by providing necessary resources. When a population reaches this line its population size is stabilised by various environmental factors.

shaalaa.com
  क्या इस प्रश्न या उत्तर में कोई त्रुटि है?
2013-2014 (March) Delhi Set 3

वीडियो ट्यूटोरियलVIEW ALL [3]

संबंधित प्रश्न

(a) Name the two growth models that represent population growth and draw the respective growth curves they represent.

(b) State the basics for the difference in the shape of these curves

(c) Which one of the curves represents the human population growth at present? Do you think such a curve is sustainable? Give reason in support of your answer.


Animals that can move from fresh water to sea called as ________.


Population having large number of postreproductive and small number of prereproductive age group is called


Which of the following would necessarily decrease the density of a population in a given habitat?


The density of a population in a habitat per unit area is measured in different units. Write the unit of measurement against the following:

Fish


What type of population growth is represented by the above age pyramid?


Draw an age pyramid for the ‘zero population growth rate’.


List any four characters that are employed in human population census.


Given below is the Age Pyramid of the population in one of the states in India as per 2011 census. It depicts the male population on the left-hand side, female population on the right-hand side, newborns towards the base and gradually increasing age groups as we move from base to the top, with the oldest population at the top. Study this pyramid and comment upon the appropriateness of the Assertion and the Reason.


                              Percentage to the total population

Assertion: It is a stable population.

Reason: The pre-reproductive and reproductive individuals are almost in equal numbers and the post-reproductive individuals are relatively fewer.


Write the best method to measure the population density of a single Banyan tree in comparison to Partlzenium weeds in a forest by an ecologist. Explain and justify your answer.


Share
Notifications

Englishहिंदीमराठी


      Forgot password?
Use app×