Advertisements
Advertisements
प्रश्न
Simplify:
Advertisements
उत्तर
\[(\frac{1}{2} \times \frac{1}{4}) + (\frac{1}{2} \times 6)\]
\[ = \frac{1}{8} + 3\]
\[ = \frac{1 + 3 \times 8}{8}\]
\[ = \frac{25}{8}\]
संबंधित प्रश्न
Express each of the following as a rational number of the form \[\frac{p}{q}:\]
Simplify:
Simplify:
Find the value and express as a rational number in standard form:
Write the following rational numbers in `p/q` form.
`3.bar17`
The rational number 10.11 in the from `p/q` is ______.
The diagram shows the wingspans of different species of birds. Use the diagram to answer the question given below:
| Albatross | Sea Gull |
 |
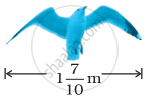 |
How much longer is the wingspan of an Albatross than the wingspan of a Sea gull?
Express `3/4` as a rational number with denominator:
–80
Write the following numbers in the form `p/q`, where p and q are integers:
One-fourth
Put the (✓), wherever applicable
| Number | Natural Number |
Whole Number |
Integer | Fraction | Rational Number |
| (a) – 114 | |||||
| (b) `19/27` | |||||
| (c) `623/1` | |||||
| (d) `-19 3/4` | |||||
| (e) `73/71` | |||||
| (f) 0 |
