Advertisements
Advertisements
प्रश्न
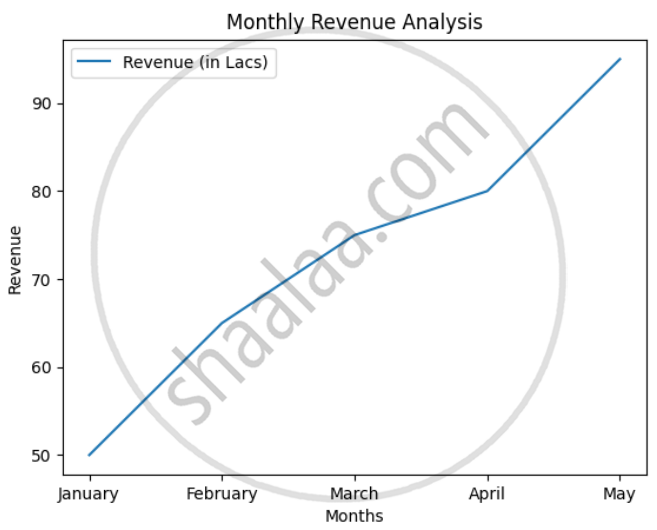
Rohan, a business analyst, is working on a Python program to create a line graph that represents the monthly revenue (in lakhs) of a company over five months. However, some parts of his code are incomplete. Help Rohan by filling in the blanks in the following Python program.
| Month | Revenue (in Lacs) |
| January | 50 |
| February | 65 |
| March | 75 |
| April | 80 |
| May | 95 |
Help Rohan to complete the code.
______ as plt #Statement−1 Months = ['January', 'February', 'March', 'April', 'May'] Revenue = [50, 65, 75, 80, 95] ______ #Statement-2 plt.xlabel('Months')
plt.ylabel('Revenue') ______ #Statement-3 ______ #Statement-4 plt.legend() plt.show()
- Write the suitable code for the import statement in the blank space in the line marked as Statement−1.
- Write the suitable code for the blank space in the line marked as Statement−2, which plots the line graph with the appropriate data and includes a label for the legend.
- Fill in the blank in Statement-3 with the correct Python code to set the title of the graph.
- Fill in the blank in Statement-4 with the appropriate Python code to save the graph as an image file named monthly_revenue.png.
Advertisements
उत्तर
import matplotlib.pyplot as pltMonths = ['January', 'February', 'March', 'April', 'May'] Revenue = [50, 65, 75, 80, 95] plt.plot(Months, Revenue, label='Revenue (in Lacs')plt.xlabel('Months')
plt.ylabel('Revenue') plt.title('Monthly Revenue Analysis')plt.savefig('monthly_revenue.png')plt.legend() plt.show()
