Advertisements
Advertisements
प्रश्न
Represent the following data by a pie-diagram:
| Items of expenditure | Expenditure | |
| Family A | Family B | |
| Food | 4000 | 6400 |
| Clothing | 2500 | 480 |
| Rent | 1500 | 3200 |
| Education | 400 | 1000 |
| Miscellaneous | 1600 | 600 |
| Total | 10000 | 16000 |
Advertisements
उत्तर
We know:
Central angle of a component = (component value/sum of component values x 360)
Here the total expenditure of family A = 10000 and family B = 11680
Thus the central angle for each component can be calculated as follows:
| Item | Expenditure (Family A) | Sector angle (Family A) | Expenditure (Family B) |
Sector angle (Family B) |
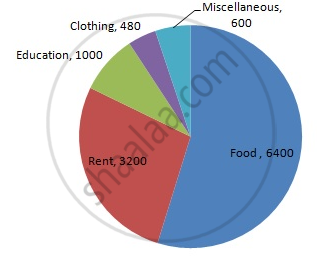
| Food | 4000 | 4000/10000 x 360 = 144 | 6400 | 6400/11680 x 360 = 197.3 |
| Clothing | 2500 | 2500/10000 x 360 = 90 | 480 | 480/11680 x 360 = 14.8 |
| Rent | 1500 | 1500/10000 x 360 = 54 | 3200 | 3200/11680 x 360 = 98.6 |
| Education | 400 | 400/10000 x 360 = 14.4 | 1000 | 1000/11680 x 360 = 30.8 |
| Miscellaneous | 1600 | 1600/10000 x 360 = 57.6 | 600 | 600/11680 x 360 = 18.5 |
Total expenditure of family A: 10000
Total expenditure of family B: 11680 (not 16000)
Now, the pie chat representing the given data can be constructed by following the steps below:
Step 1 : Draw circle of an appropriate radius.
Step 2 : Draw a vertical radius of the circle drawn in step 1.
Step 3 : Choose the largest central angle. Here the largest central angle is 144o. Draw a sector with the central angle 144o in such a way that one of its radii coincides with the radius drawn in step 2 and another radius is in its counter clockwise direction.
Step 4 : Construct other sectors representing the other items in the clockwise sense in descending order of magnitudes of their central angles.
Step 5 : Shade the sectors with different colours and label them, as shown as in figure below.\
Family A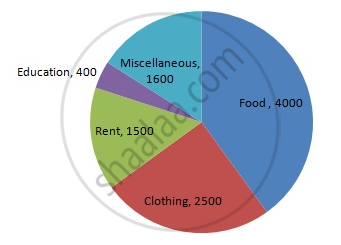
Family B