Advertisements
Advertisements
प्रश्न
Plot the following points in the coordinate plane and join them. What is your conclusion about the resulting figure?
(0, −4) (0, −2) (0, 4) (0, 5)
Advertisements
उत्तर

The line is on the y−axis.
APPEARS IN
संबंधित प्रश्न
Write the coordinates of each of the following points marked in the graph paper:
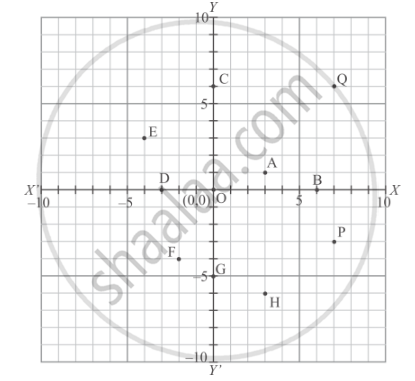
Plot the following point on the graph paper:
(2, 5)
Plot the following point on the graph paper:
(4, −3)
On a graph paper plot the points A (3, 0), B(3, 3), C(0, 3). Join A, B and B, C. What is the figure formed?
Plot the following point in the coordinate system and identify the quadrant.
R(−6, −7)
Plot the following point in a graph sheet.
D(−1, −1)
Plot the following point in a graph sheet.
G(7, −4)
If P(5, 1), Q(8, 0), R(0, 4), S(0, 5) and O(0, 0) are plotted on the graph paper, then the point(s) on the x-axis are ______.
Plot the points (x, y) given by the following table. Use scale 1 cm = 0.25 units
| x | 1.25 | 0.25 | 1.5 | – 1.75 |
| y | – 0.5 | 1 | 1.5 | – 0.25 |
Taking 0.5 cm as 1 unit, plot the following points on the graph paper:
A(1, 3), B(– 3, – 1), C(1, – 4), D(– 2, 3), E(0, – 8), F(1, 0)
