Advertisements
Advertisements
प्रश्न
Observe the market supply schedule of potatoes and answer the following question:
| Price in ₹ | Firms | Market supply (kg) | ||
| A | B | C | ||
| 1 | ____ | 20 | 45 | 100 |
| 2 | 37 | 30 | 45 | _____ |
| 3 | 40 | ____ | 55 | 155 |
| 4 | 44 | 50 | _____ | 154 |
- Complete the quantity of potatoes supplied by the firms to the market in the above table.
- Draw the market supply curve from the schedule and explain it.
संक्षेप में उत्तर
Advertisements
उत्तर
Price in ₹ Firms Market supply (kg) A B C 1 35 20 45 100 2 37 30 45 112 3 40 60 55 155 4 44 50 60 154 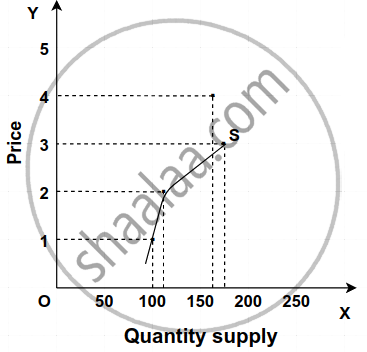
In the diagram, the quantity supplied is shown on the X-axis and the price on the Y-axis.
A. Supply curve SS slopes upward from left to right indicating a direct relationship between price and market supply.
B. It is pertinent to note that when the price rises from price 3 to price 4, the supply more or less remains the same at 155 quantity supply.
C. This shows that agricultural goods are an exception to the law of supply. Their supply is inelastic in the short term.
shaalaa.com
क्या इस प्रश्न या उत्तर में कोई त्रुटि है?
