Advertisements
Advertisements
प्रश्न
Observe the following graph and answer the question given below.

- Which region has the highest literacy rate?
- Which region has the lowest literacy rate?
- In which region does women fare better than men in literacy rate?
- Write a concluding paragraph about the graph.
- What does this graph tells us?
Advertisements
उत्तर
- Central Asia has the highest literacy rate.
- Sub-Saharan Africa has the lowest literacy rate.
- There is no any country, which has more female rate than male, expect where there is full literacy rate as central Asia.
- Literacy rate of the country is an indicator of its socio-economic development. The literacy rate of the country should be high, for both male and female, then the development can be possible. The standard of living of people will increase and all type of development can be possible.
- This graph tells us the differences in literacy rates.
APPEARS IN
संबंधित प्रश्न
Answer in detail :
Outline the importance of population pyramids in the study of populations.
Write short note.
Literacy and education
Why have many European countries have deficit males?
Why is the age structure considered an important indicator of population composition? Give one reason.
Triangular shaped Pyramid refers to ______.
Bell shaped Pyramid refers to ______.
Study the given graph carefully and answer the following question:
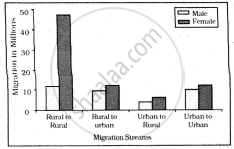
Intra-state Migration by place of Last Residence Indicating Migration Streams India, 2011
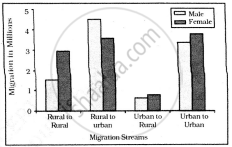
Inter-state Migration by Place of Last Residence Indicating Migration Streams India, 2011
What is the main cause of male migration from rural to urban?
Identify the correct group or factor.
Which one of the following is the largest linguistic group of India?
Which one of the following is the largest linguistic group of India?
