Advertisements
Advertisements
प्रश्न
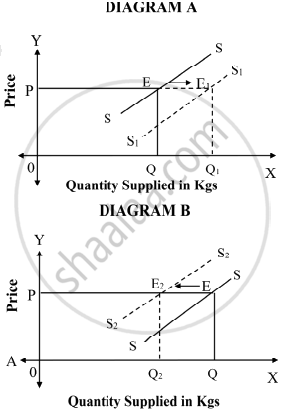
Observe the following diagrams and answer the questions given below:
Questions:
- Diagram ‘A’ represent a ______ in supply. (1)
- Diagram ‘B’ represents a ______ in supply. (1)
- In diagram ‘A’, the supply curve shifts to the ______ side of the original supply curve. (1)
- In diagram ‘B’, the supply curve shifts to the ______ side of the original supply curve. (1)
रिक्त स्थान भरें
Advertisements
उत्तर
- Diagram ‘A’ represent a increase in supply.
- Diagram ‘B’ represents a decrease in supply.
- In diagram ‘A’, the supply curve shifts to the right side of the original supply curve.
- In diagram ‘B’, the supply curve shifts to the left side of the original supply curve.
shaalaa.com
क्या इस प्रश्न या उत्तर में कोई त्रुटि है?
