Advertisements
Advertisements
प्रश्न
Marks obtained by 40 students in an examination are given below:
| Marks | 10 – 20 | 20 – 30 | 30 – 40 | 40 – 50 | 50 – 60 | 60 – 70 |
| No. of students | 3 | 8 | 14 | 9 | 4 | 2 |
Using graph paper, draw an ogive and estimate the median marks.
Advertisements
उत्तर
1. Construct the cumulative frequency table
To draw an ogive a cumulative frequency curve, we first need to determine the cumulative frequency (cf) for each class interval based on its upper limit.
| Marks (Class interval) |
Frequency (f) |
Upper Boundary |
Cumulative Frequency (cf) |
| 10 – 20 | 3 | 20 | 3 |
| 20 – 30 | 8 | 30 | 11 (3 + 8) |
| 30 – 40 | 14 | 40 | 25 (11 + 14) |
| 40 – 50 | 9 | 50 | 34 (25 + 9) |
| 50 – 60 | 4 | 60 | 38 (34 + 4) |
| 60 – 70 | 2 | 70 | 40 (38 + 2) |
2. Plot the Ogive
The ogive is plotted by taking the Upper Boundary on the x-axis and the Cumulative Frequency on the y-axis.
1. Coordinate Points: Plot the points (20, 3), (30, 11), (40, 25), (50, 34), (60, 38) and (70, 40).
2. Origin Point: Additionally, plot (10, 0) as the starting point representing the lower limit of the first class.
3. Drawing: Join these points with a smooth, freehand curve to form the “less than” ogive.
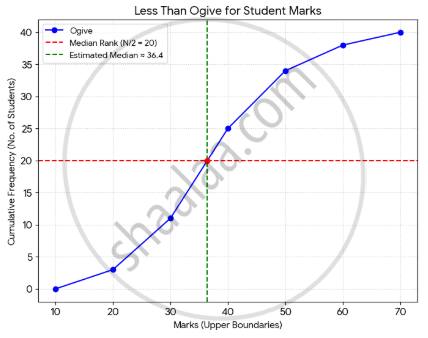
3. Estimate the media
The median is the value on the x-axis that corresponds to the middle rank of the data.
1. Find the median rank: Since the total number of students (n) is 40, the median rank is `N/2 = 40/2 = 20`.
2. Locate on graph: Find 20 on the y-axis (Cumulative Frequency). Draw a horizontal line from y = 20 to the ogive curve.
3. Determine x-value: From that point on the curve, draw a vertical line down to the x-axis. The point where this line meets the x-axis is the estimated median marks.
Based on the graph, the horizontal line from 20 on the y-axis meets the curve at a point whose x-coordinate is approximately 36.4.
Thus, the estimated median marks are 36.4.
Notes
The answer in the textbook is incorrect.
