Advertisements
Advertisements
प्रश्न
In the following table, data of the transport means used by students in 8th standard for commutation between home and school is given. Draw a subdivided bar diagram to show the data.
(Scale : On Y axis : 1 cm = 500 students)
| Town → | Paithan | Yeola | Shahapur |
| Mean of Communication ↴ | |||
| cycle | 3250 | 1500 | 1250 |
| Bus and Auto | 750 | 500 | 500 |
| On foot | 1000 | 1000 | 500 |
Advertisements
उत्तर १
We have, the following table that shows the data of the transport means used by students in 8th standard for commutation between home and school is given.
| Town → | Paithan | Yeola | Shahapur |
| Mean of Communication ↴ | |||
| cycle | 3250 | 1500 | 1250 |
| Bus and Auto | 750 | 500 | 500 |
| On foot | 1000 | 1000 | 500 |
The subdivided bar diagram of the given data is as follows:

उत्तर २
(Scale : On Y axis : 1 cm = 500 students)
| Town → | Paithan | Yeola | Shahapur |
| Mean of Communication ↴ | |||
| cycle | 3250 | 1500 | 1250 |
| Bus and Auto | 750 | 500 | 500 |
| On foot | 1000 | 1000 | 500 |
| Total | 5000 | 3000 | 2250 |

संबंधित प्रश्न
Observe the following graph and answer the question.
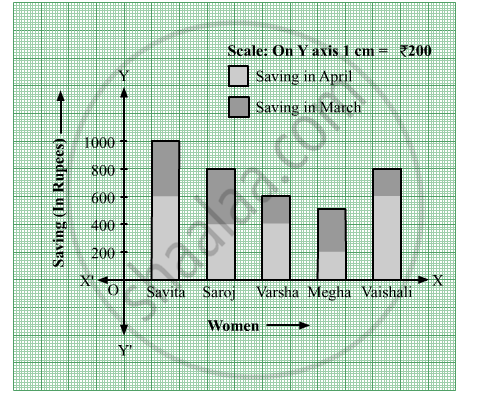
- State the type of the graph.
- How much is the savings of Vaishali in the month of April?
- How much is the total savings of Saroj in the months March and April?
- How much more is the total savings of Savita than the total savings of Megha?
- Whose savings in the month of April is the least?
The number of boys and girls in std 5 to std 8 in a Z.P. school is given in the table. Draw a subdivided bar graph to show the data.
(Scale : On Y axis, 1 cm = 10 students)
| Standard | 5th | 6th | 7th | 8th |
| Boys | 34 | 26 | 21 | 25 |
| Girls | 17 | 14 | 14 | 20 |
In the following table number of trees planted in the year 2016 and 2017 in four towns is given. Show the data with the help of subdivided bar graph.
| Town → | Karjat | Wadgoan | Shivapur | Khandala |
| Year ↴ | ||||
| 2016 | 150 | 250 | 200 | 100 |
| 2017 | 200 | 300 | 250 | 150 |
