Advertisements
Advertisements
प्रश्न
In a single-slit diffraction experiment, light of wavelength λ illuminates the slit of width ‘a’. The diffraction pattern is observed on a screen kept at a distance D from the slits.
- Depict variation of intensity in the fringe pattern with the angular position of the fringes.
- How is the linear width of central maximum affected when separation between the slit and the screen is decreased?
Advertisements
उत्तर
i.
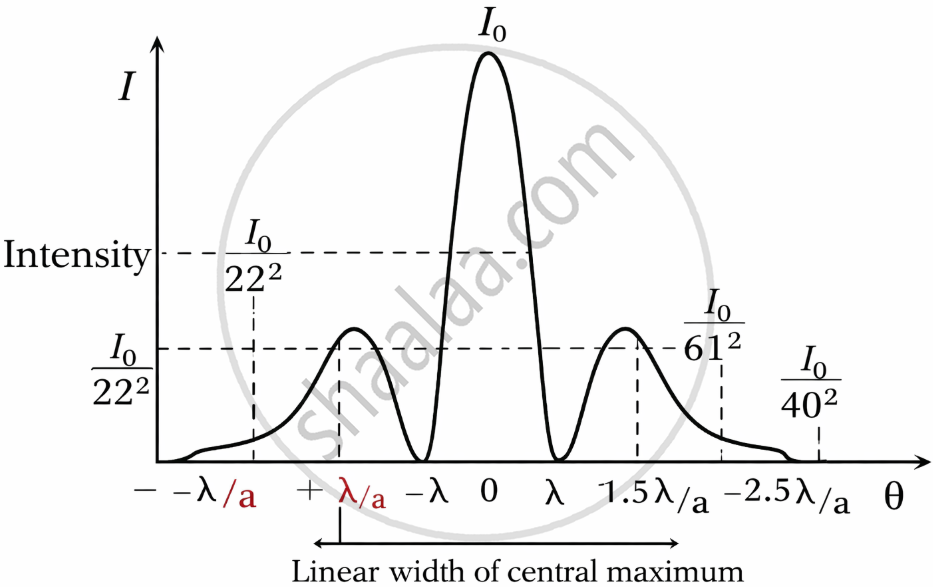
The graph of intensity (I) versus angular position (θ) or sin θ shows:
- A central peak at θ = 0 with maximum intensity I0.
- First minima occurring at sin θ = `+-lambda/a`
- Secondary maxima occurring roughly at sin θ = `+-(1.5 lambda)/a, +-(2.5 lambda)/a` etc., with rapidly decreasing intensity.
The intensity of the central maximum is much higher than the secondary ones (roughly in the ratio 1 : `1/22` : `1/61`).
ii. Linear Width of Central Maximum:
The linear width of the central maximum (W) is defined as the distance between the first minima on either side of the center.
The angular position of the first minimum is θ ≈ `lambda/a`.
The linear distance from the center to the first minimum is y = D tan θ
≈ `lambda/a`
Total linear width (W) = 2y
= `(2 D lambda)/a`
From the formula,
W = `(2 D lambda)/a`
We see that W ∝ D.
Therefore, if the separation between the slit and the screen (D) is decreased, the linear width of the central maximum will decrease.
