Advertisements
Advertisements
प्रश्न
Give an account of the occupational structure of India’s population.
Advertisements
उत्तर
The population of India according to their economic status is divided into three groups, namely; main workers, marginal workers, and non-workers. It is observed that in India, the proportion of workers (both main and marginal) is only 39 percent (2001) leaving a vast majority of 61 percent as non-workers. This indicates an economic status in which there is a larger proportion of the dependent population, further indicating the possible existence of a large number of unemployed or under-employed people.
The occupational composition of India’s population (which actually means engagement of an individual in farming, manufacturing trade, services, or any kind of professional activities) shows a large proportion of primary sector workers compared to secondary and tertiary sectors. About 58.2 per cent of the total working population are cultivators and agricultural labourers, whereas only 4.2% of workers are engaged in household industries and 37.6% are other workers including non-household industries, trade, commerce, construction and repair and others. services. As far as the occupation of the country’s male and female population is concerned, male workers outnumber female workers in all three sectors. The number of female workers is relatively high in the primary sector, though in recent years there has been some improvement in the work participation of women in secondary and tertiary sectors.
The participation rate in secondary and tertiary sectors has registered an increase. This indicates a shift of dependence of workers from farm-based occupations to non-farm-based ones, indicating a sectoral shift in the economy of the country. The spatial variation of work participation rate in different sectors in the country is very wide. For instance, the states like Himachal Pradesh and Nagaland have very large shares of cultivators. On the other hand states like Andhra Pradesh, Chhattisgarh, Odisha, Jharkhand, West Bengal and Madhya Pradesh have a higher proportion of agricultural labourers. The highly urbanized areas like Delhi, Chandigarh and Puducherry have a very large proportion of workers being engaged in other services.
APPEARS IN
संबंधित प्रश्न
Write a short note on:
Population pyramid and sex ratio.
Write a short note on:
Occupational structure of a population.
Give geographical reasons:
Literacy rate of a country is an indicator of its socio-economic development.
Differentiate between:
Expansive population pyramid and Constrictive population pyramid.
Answer in detail :
Outline the importance of population pyramids in the study of populations.
Assertion: The working population classified according to occupations is known as occupational structure.
Reason: Occupational structure indicates development of a country.
Identify the incorrect factor
Type of age-sex pyramid:
Identify the incorrect factor
Regions having literacy more than 80%:
Identify the incorrect factor
Pull factors of migration:
Write short note
Occupational structure of India
Which one of the following countries has the highest sex ratio in the world?
What do you understand by population composition?
How does the sex ratio give important information about the status of women in a country?
Which of the following is the largest religious minority in India?
Broad base of age-sex pyramid refers to ______.
Which attribute does not distinguish people?
Study the given graph carefully and answer the following question:
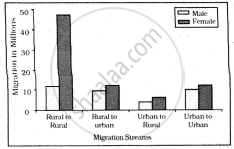
Intra-state Migration by place of Last Residence Indicating Migration Streams India, 2011
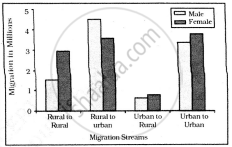
Inter-state Migration by Place of Last Residence Indicating Migration Streams India, 2011
What is the main cause of female migration from rural to urban?
Table: India-Class-wise number of towns and cities and their population, 2011
| Class | Population Size | Number of Cities | Total Urban Population (in thousands) | % of Total Urban Population |
| I | 1,00,000 & more | 568 | 2,27,899 | 60-45 |
| II | 50,000-99,999 | 474 | 41,328 | 10-96 |
| III | 20,000-49,999 | 1,373 | 58,174 | 15-43 |
| IV | 10,000-19,999 | 1,683 | 31,866 | 8-45 |
| V | 5,000-9,999 | 1,749 | 15,883 | 4-21 |
| VI | less than 5,000 | 424 | 1,956 | 0-52 |
Source: Census of India-2011 and India 2017, Ministry of Information and Broadcasting, Government of India.
Which class town has the minimum urban population?
The significance of age-structure is/are?
Match the following and choose the correct option.
| Population | Pyramid shape |
| A. Constant population | 1. Perfect triangle shape |
| B. Declining population | 2. Bell shape |
| C. Expanding population | 3. Narrow Base & Tapered Top Shape |
Mining is a ______.
Arrange according to increase in age :
- Adults
- Children
- Old people
- Young people
Draw neat, labelled diagram:
Stationary pyramids
Which one of the following is the largest linguistic group of India?
Which one of the following is the largest linguistic group of India?
Which one of the following is the largest linguistic group of India?
